Matrix Organization
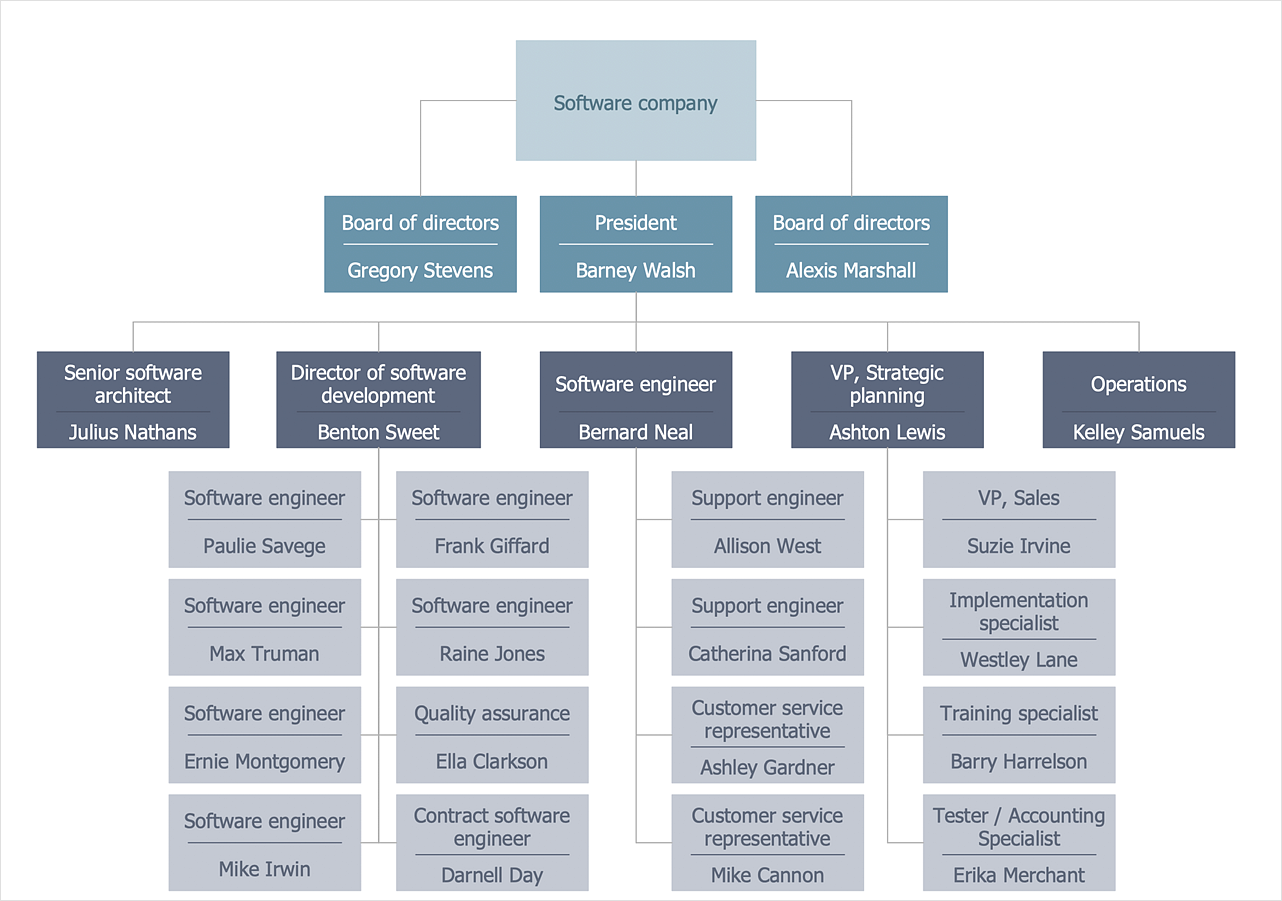
Different organizations have different organizational structures. Matrix organization is one of the most popular and widely used type of organizational structure. Use ConceptDraw DIAGRAM diagramming and vector drawing software extended with 25 Typical Orgcharts solution from the Management area of ConceptDraw Solution Park for fast and easy designing matrix organizational chart for your company.Orgchart
Workforce planning is strategically important for each company, organization, enterprise, and corporation, non important it is business, commercial, non-profit or government organization. Organizational Chart or Orgchart is a type of diagram that is successfully used to graphically illustrate the structure of an organization and also relationships between its parts. There are three different types of Orgcharts: hierarchical, matrix and flat. ConceptDraw DIAGRAM diagramming and vector drawing software supplied with Organizational Charts Solution from Management Area is the best for easy designing professional-looking Orgcharts. This solution provides you the predesigned samples and Organizational Chart library with ready-to-use vector objects required for Orgchart design. It also offers the most simple way of drawing - the possibility to start with one of built-in Orgchart templates. Typically Orgcharts require for regular updating and making modifications, in ConceptDraw DIAGRAM it is fast and easy, the blocks are editable and remain connected when they are moved.Create Floor Plans Easily with ConceptDraw DIAGRAM
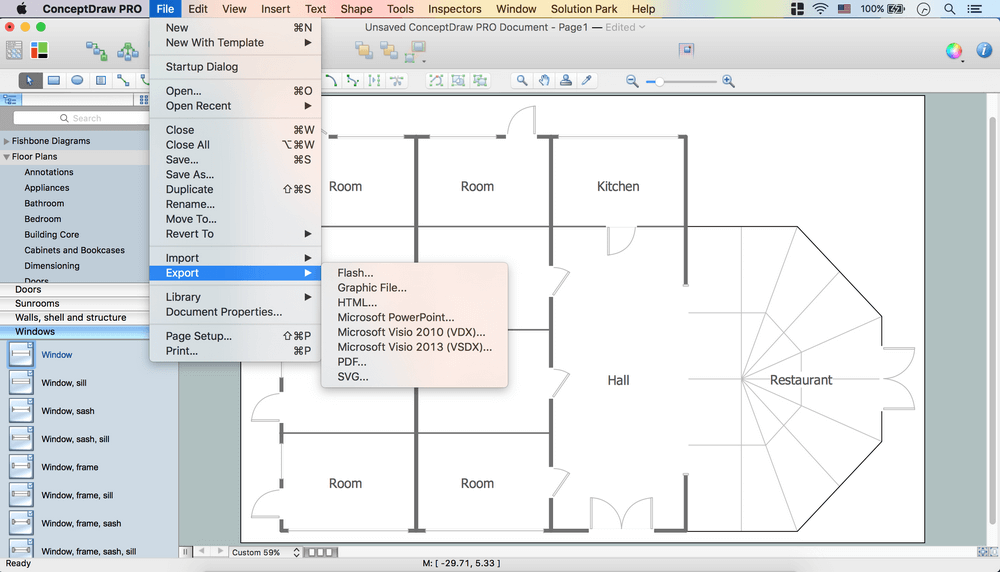
How to create Floor Plan Design easy and effectively? You can invite an interior designer and trust this work to him, which is usually expensive and result may not always meet your expectations. Another way is to design it yourself, but at this case you need to have special skills, knowledges and abilities, among them basic knowledge of the composition rules, color theory, materials science and software for interior design development. The ability to use specialized software for drawing is especially valuable, useful and saves your time. ConceptDraw DIAGRAM is one of the best among similar software, it offers extensive functionality, powerful tools, a lot of features, and is simple for using, so can be applied by everyone without efforts. Enhanced with Floor Plans and other solutions from the Building Plans area, the ConceptDraw DIAGRAM software helps easily create unique and harmonious interior designs, and draw in desired scale professional-looking Floor Plans and Layouts for homes, apartments, hotels, offices, and other buildings. ConceptDraw DIAGRAM is a full Visio compatibility and better alternative for students, teachers and business professionals to reliably create kinds of flowcharts, organizational charts, network diagrams, floor plans, electrical diagrams, software design diagrams, maps and more.
 Organizational Charts
Organizational Charts solution extends ConceptDraw DIAGRAM software with samples, templates and library of vector stencils for drawing the org charts.
HelpDesk
How to Draw a Hierarchical Organizational Chart
There are a number of different organizational structures. The most appropriate structure will depend on the size of the business and the type of business. A hierarchical organizational structure is one of the most typical organizational structure. This structure can be represented as a pyramid, with a single entity in authority at the top, with subsequent levels of power beneath them. Each member of the pyramid reports only to their direct subordinates or superiors, limiting the amount of communication overhead, which can be seen both as an asset or a limitation. It is easy to see where a hierarchical structure would be an effective solution; companies that have offices based in disparate locations, a business that focuses on diversified markets, any organization with a need for multiple levels of middle management. You can easily create a clear hierarchical organizational chart using ConceptDraw solution that contains templates of the 25 Typical Orgcharts.Workflow Diagram
Workflow diagram is a perfect tool to represent visually a repeatable pattern of organizational activity that is powered by resources and to describe in details the transferring of data, documents or tasks during a work process. It effectively explains and documents the process flow that exists and that requires the studying, analyzing and execution. Workflow diagrams help to represent the working processes in a simple visual manner, to follow easy the path of a task in a workflow, to identify the persons responsible for the execution of each stage, to show the accompanied documents and needed resources. All this helps to optimize the workflow and to discover its weak points. Workflow diagrams are mainly designed and used as a part of project documentation, certification process and company policies to comply the standards. To design professionally the Workflow diagrams, use the ConceptDraw DIAGRAM software. Enhanced with Workflow Diagrams solution from the Business Processes area, the ConceptDraw DIAGRAM it is a powerful workflow diagram maker.Organizational Charts with ConceptDraw DIAGRAM
Organizational chart or Orgchart is a diagram that depicts the structure of an organization using the terms of work responsibility and rank position. It is a useful and convenient format to visually illustrate the relationships within an organization, which is moreover applicable for organization of any size. Typically, an Organizational chart is constructed from the rectangular object blocks, which represent a job title, a person's name and relationships associated with them. You looks for the powerful Orgchart software? ConceptDraw DIAGRAM software is exactly what you've been searching long. Extended with Organizational Charts Solution, ConceptDraw DIAGRAM offers great-looking examples and samples of Orgcharts, built-in templates and various types of predesigned vector block objects and connectors for creation all kinds of Organizational Charts - from simple to complex multi-page. When designing the chart for large organization with complex branched structure, may be convenient to divide it into few smaller charts.Flowchart design. Flowchart symbols, shapes, stencils and icons
A flowchart is a type of diagram which represents an algorithm, process or workflow, displays the steps as boxes of various kinds and depicts their order by connecting them with arrows. Any business graphic document will be more colorful and understandable if will use professional-looking and visual diagrams and flowcharts. Flowchart design gives versatile presenting and explaining of the process. ConceptDraw DIAGRAM flowchart software enhanced with Flowcharts solution helps effectively make Flowchart Design. Use of predesigned flowchart symbols and bright color palette offers a fresh view and favorably distinguishes the flowcharts designed in ConceptDraw DIAGRAM from the black and white flowcharts on a paper. Preferably to use no more than three or four colors and apply identical for the same shape types. The best flowchart design can be achieved by starting with Flowchart template, or any of suitable ready examples or samples offered in ConceptDraw STORE, open one of them and enter the proper text into each Flowchart shape. Each symbol of the flowchart has a definition that can't be changed. This means that all flowcharts shapes can be grouped in according to their meaning. Users with ConceptDraw DIAGRAM flowchart software can style groups of symbols with close definitions by color sets chosen from complementary palette. Almost all workflows can be depicted as a flowchart. Colored diagrams are more light for perception of the certain information, this is part of flowchart design. Bright colors need to be used in the key points of Decision symbols, to focus attention on their importance for whole process flow.
Organizational Structure
The organizational structure reflects the composition and hierarchy of company's divisions, determines the distribution of authorities and responsibilities within the organization, and facilitates the understanding by workers their responsibilities. It also defines the group of people making key decisions at the company. Visualization of organizational structure of any company, organization or institution is not an easy task, because sometimes the company may include several departments, each with more than thousand persons. For such large organizations often are created the Organizational charts for every department separately. There are many ways of organization's structuring, which determine its work. Often happens that organizational structure adapts to production process. ConceptDraw DIAGRAM extended with unique Organizational Charts solution from Management area of ConceptDraw Solution Park is a powerful organizational structure software, which ideally suits for developing Organizational Charts of any type and any complexity.Is ConceptDraw DIAGRAM an Alternative to Microsoft Visio?
Visio for Mac and Windows - ConceptDraw as an alternative to MS Visio. ConceptDraw DIAGRAM delivers full-functioned alternative to MS Visio. ConceptDraw DIAGRAM supports import of Visio files. ConceptDraw DIAGRAM supports flowcharting, swimlane, orgchart, project chart, mind map, decision tree, cause and effect, charts and graphs, and many other diagram types.- Visio Org Chart
- How To Draw Context Level Diagram In Visio
- Visio Org Chart Group By Department
- Process Flowchart | Basic Flowchart Symbols and Meaning ...
- Pyramid Diagram | Process Flowchart | Pyramid Diagram | Chart Of ...
- Pyramid Diagram | 4 Level pyramid model diagram - Information ...
- Basic Flowchart Symbols and Meaning | Audit Flowchart Symbols ...
- Basic Flowchart Symbols and Meaning | Process Flow Chart | Flow ...
- Process Flowchart | Examples of Flowcharts, Org Charts and More ...


