Flowchart Software
Flowchart is a simple diagram, map or graphical schematic representation the sequence of actions within a process. It is ideal for displaying how a process currently flows or can function ideally. The Flowcharts let define the steps and boundaries of a process, uncover problems or miscommunications. The Flowcharts are widely used in education, software development, business, economics, thanks to their visuality they are ideal for presentations, reports, for using on conferences to help the audience comprehend the content better, or easy find flaws in a process flow diagrams. ConceptDraw DIAGRAM is professional flowcharts software and feature-rich flowchart maker, which supports Mac OS X and Windows. It contains at ConceptDraw Solution Park a rich set of stencils and professional flowchart symbols for design. It lets create simply professional-looking Flowcharts based on thousand free flowchart templates, colored symbols and examples. ConceptDraw DIAGRAM is a 3 times cheaper alternative to MS Visio available for both Mac and PC. It’s is another full featured business and technical diagramming application that can easily take care of Visio files within OS X. Another bonus with ConceptDraw DIAGRAM – it's cross-platform. You can work on a document in both OS X and Windows, skipping Visio entirely.
Organizational Chart Template
Organizational Charts help to show the relationships of positions within an organization in terms of authority and responsibility. They typically give an actual and clear “snapshot” picture of an organization for both employees and individuals outside, they visually show divisions of work, levels of management, and reporting relationships. ConceptDraw DIAGRAM graphical software supplied with Organizational Charts Solution from the Management Area of ConceptDraw Solution Park offers a number of ready-made organizational chart samples, examples and templates, which you can use as a foundation in your drawing. All they are grouped in topical sets as organizational chart template files and allow easily depict a wide array of organizational structure types, and to represent any business organizational structure, matrix organization structure, or functional structure. Inside the Organizational Charts solution you will find also a set of vector shape libraries containing a lot of icons needed for effective illustration the Organizational Structure Charts of any complexity.IDEF0 Visio
ConceptDraw DIAGRAM extended with IDEF0 Diagrams solution from the Software Development area of ConceptDraw Solution Park is a powerful diagramming and vector drawing IDEF0 software. All IDEF0 diagrams created in ConceptDraw DIAGRAM are vector graphic documents and can be reviewed, modified and converted to MS Visio XML format. To obtain the IDEF0 Visio documents from ConceptDraw DIAGRAM documents use the wide export possibilities of ConceptDraw DIAGRAM.Organizational Chart Templates
ConceptDraw offers you a number of ready-made organizational chart templates which you can use in your drawing. They are grouped in topical sets as organizational chart template files. Use the Organizational Charts Solution for ConceptDraw DIAGRAM to create your own Organizational Charts of any complexity quick, easy and effective. The Organizational Charts designed with ConceptDraw DIAGRAM are vector graphic documents and are available for reviewing, modifying, converting to a variety of formats (image, HTML, PDF file, MS PowerPoint Presentation, Adobe Flash or MS Visio XML), printing and send via e-mail in one moment.
Stakeholder Onion Diagram Template
For depicting the onion model are actively used Stakeholder Onion Diagrams. The ConceptDraw DIAGRAM diagramming and vector drawing software extended with Stakeholder Onion Diagrams Solution from the Management Area of ConceptDraw Solution Park offers the number of useful tools and Stakeholder Onion Diagram template for their easy design.Cisco Network Topology. Cisco icons, shapes, stencils and symbols
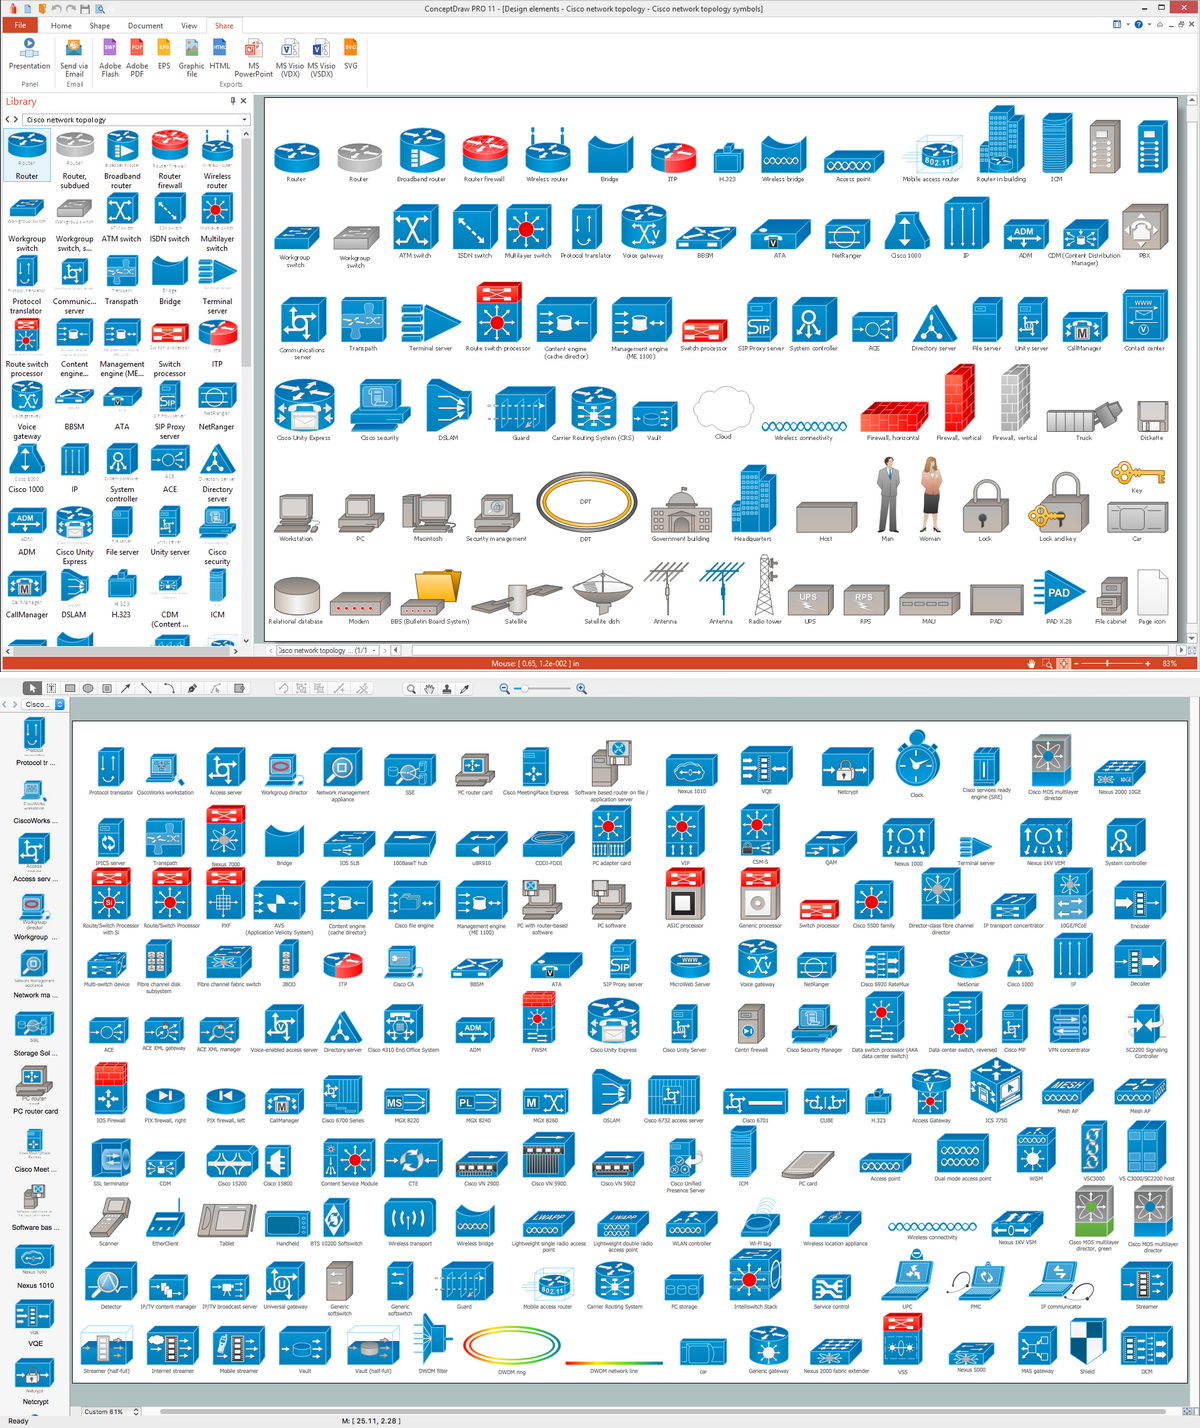
Cisco Network Topology represents the arrangement of worldwide recognized and standardized Cisco network symbols, icons, shapes, and stencils which help visualize the schemes of computer networks. Any equipment used in Cisco networks is also named a node and network topology diagram represents the scheme of connection the used nodes. Cisco Network Diagram illustrates how the signals enter on the networked devices and how the data spread within a network from one device to another. These diagrams are useful for engineers while constructing computer networks and working with them. Cisco Network Diagrams solution included to Computer and Networks area of ConceptDraw Solution Park contains quick-start templates, professionally designed samples and examples, and numerous libraries with a lot of predesigned vector design elements, icons, and shapes of Cisco equipment, components, devices, links which provide for ConceptDraw DIAGRAM users a perfect possibility of simple and quick drawing Cisco Network Diagrams and Schematics, Network Designs and Maps of any complexity.Fishbone Diagram Template
A causal model is an abstract concept, that describes the causal mechanisms of a system, by noting certain variables and their influence on each other, in an effort to discover the cause of a certain problem or flaw. This model is presented in diagram form by using a fishbone diagram. ConceptDraw DIAGRAM diagramming and vector drawing software enhanced with Fishbone Diagrams solution helps you create business productivity diagrams from Fishbone diagram templates and examples, that provide to start using of the graphic method for the analysis of problem causes. Each predesigned Fishbone Diagram template is ready to use and useful for instantly drawing your own Fishbone Diagram.Donut Chart Templates
These donut chart templates was designed using ConceptDraw DIAGRAM diagramming and vector drawing software extended with Pie Charts solution from Graphs and Charts area of ConceptDraw Solution Park. All these donut chart templates are included in the Pie Charts solution. You can quickly rework these examples into your own charts by simply changing displayed data, title and legend texts.Cisco Routers. Cisco icons, shapes, stencils and symbols
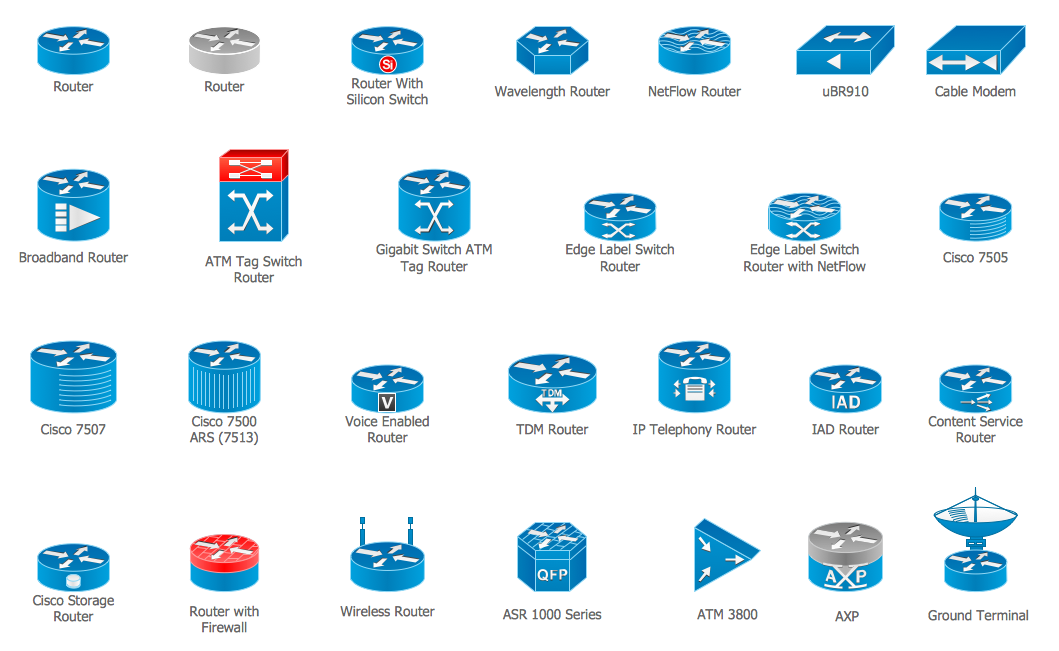
Network infrastructure planning is a very important process in the network construction, and the share of time allocated to this within the scope of the entire project may reach 60-80%. A competent and thorough approach to planning contributes to the quick investment return, and also increases the reliability and flexibility of the final system, reducing the probability of additional costs related to the incorrect implementation. Any planning begins with an analysis of the business requirements to the final system. Basic network parameters, which should be assessed are the scalability, accessibility, cost, speed and safety. Speed and cost are often mistaken for the most important parameters, and the rest of the parameters aren't even remembered. This is not entirely correct. Initially, it is necessary to assess the business plans for the future, because sometimes it is more profitable to invest more money in the beginning. If the business is to develop, then, consequently, demands on- Visio Swimlane Template Download
- Emergency Evacuation Visio Download
- Download Visio Shapes
- Visio Data Flow Diagram Template Download
- Visio Site Plan Template Download
- Idef0 Visio Template Download
- Plumbing and Piping Plans | Visio Plumbing Stencils Download
- Visio Data Flow Diagram Stencil Download
- Visio Landscape Stencils Download
- Decision Tree Template Visio


