Visio Files and ConceptDraw
Visio Files and ConceptDraw. ConceptDraw DIAGRAM is compatible with MS Visio.VDX formatted files.VDX is Visio’s open XML file format, and it can be easily imported and exported by ConceptDraw DIAGRAM.MS Visio Look a Like Diagrams
No need for any special drawing skills to create professional looking diagrams outside of your knowledge base. ConceptDraw DIAGRAM takes care of the technical details, allowing you to focus on your job, not the drawing. ConceptDraw DIAGRAM delivers full-functioned alternative to MS Visio. ConceptDraw DIAGRAM supports import of Visio files. ConceptDraw DIAGRAM supports flowcharting, swimlane, orgchart, project chart, mind map, decision tree, cause and effect, charts and graphs, and many other diagram types.ConceptDraw DIAGRAM Compatibility with MS Visio
The powerful diagramming and business graphics tools are now not exception, but the norm for today’s business, which develop in incredibly quick temp. But with the abundance of powerful business diagramming applications it is important to provide their compatibility for effective exchange the information between the colleagues and other people who maybe use different software in their work. During many years Microsoft Visio™ was standard file format for the business and now many people need the visual communication software tools that can read the Visio format files and also export to Visio format. The powerful diagramming and vector drawing software ConceptDraw DIAGRAM is ideal from the point of view of compatibility with MS Visio. Any ConceptDraw DIAGRAM user who have the colleagues that use MS Visio or any who migrates from Visio to ConceptDraw DIAGRAM , will not have any problems. The VSDX (Visio′s open XML file format) and VDX formatted files can be easily imported and exported by ConceptDraw DIAGRAM , you can see video about this possibility.HelpDesk
How to Convert Visio Stencils for Use in ConceptDraw DIAGRAM
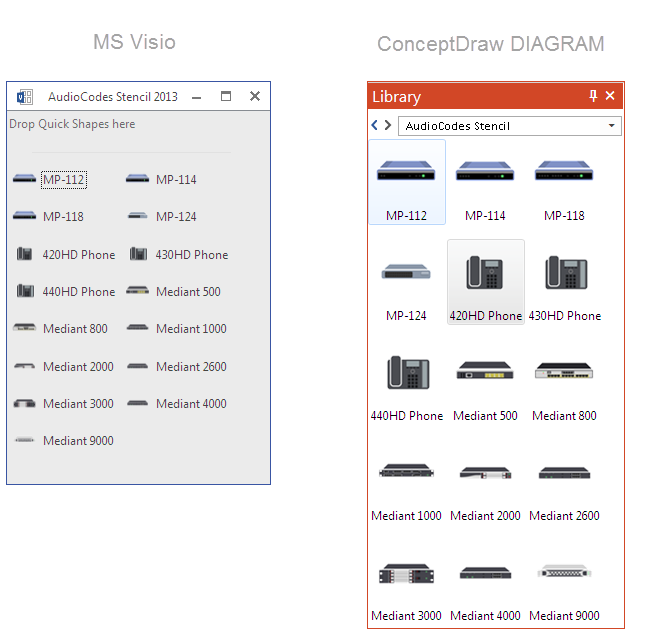
MS Visio provides users with a number of predefined stencils. Standard Visio stencils contain shapes that are basically used to create diagrams. The shapes can range from simple flow chart boxes or lines to more complicated shapes like servers, racks or anything else that needs to be represented in a graphical form. ConceptDraw DIAGRAM supports the possibility to open Visio stencils. With the introduction of Visio 2013, Microsoft has changed the native file format used in earlier versions of Microsoft Visio. Thus, when you are looking for a professional tool to open and save in the newer Visio 2013 file format on Mac, ConceptDraw DIAGRAM is the solution for you. ConceptDraw DIAGRAM file import and export work round-trip with the new Visio VSDX file format and at the same time supports the improved import of VDX file format. To use Visio stencils created with MS Visio 2010 in your diagrams, created with ConceptDraw DIAGRAM, follow the steps described in the following article.HelpDesk
How To Make Visio Circle-Spoke Diagram
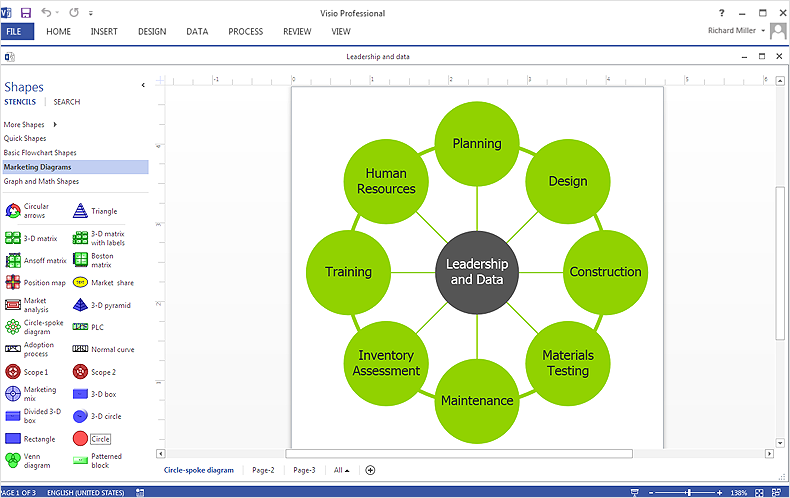
Circle-Spoke Diagram consists of a central round balloon, which is circled with other balloons as a ring. The Circle-Spoke Diagram is usually used in marketing. It shows the relationships between entities and the central element. Circle-Spoke Diagram can be used in marketing documentation and presentations. ConceptDraw DIAGRAM allows you to easily create marketing charts of any complexity, including the circle-spoke diagram and then make an MS Visio file from your diagram in a few simple steps. You can easily design your business documentation and share it easily with MS Visio users.HelpDesk
How to Open Visio® VDX File Using ConceptDraw DIAGRAM
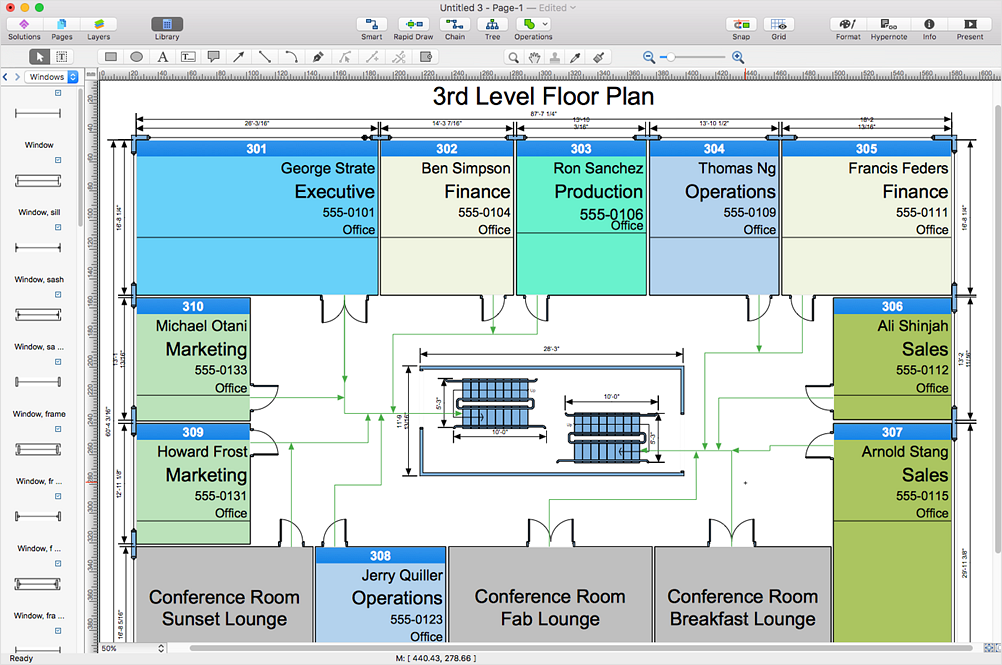
MS Visio file with the extension. VDX can be created with the MS Visio 2003-2007. It is a filename extension for the MS Visio XML drawing file format. MS Visio 2010 and earlier versions support reading and writing files in a binary VSD or XML-based VDX file formats. Since MS Visio 2013 drawing files are written in the new VSDX and VSDM file formats. The writing VDX files are no longer supported. If you used MS Visio 2003-2010 before and now is considering to switch to ConceptDraw DIAGRAM v12, maybe this is a good news - ConceptDraw DIAGRAM v12 is still supported reading and writing of Microsoft Visio XML file format. Thus replacing the diagramming software, allows keeping all your drawings, created in the old versions of MS Visio. Making business drawings with ConceptDraw DIAGRAM v12 is easier than using MS Visio. Moreover, you will be able to use a huge number of business-oriented libraries supplied by ConceptDraw Solutions. Also, using ConceptDraw you can create your custom objects and supplement libraries to cover your requirements.HelpDesk
How to Change the Timescale in a Gantt Chart View
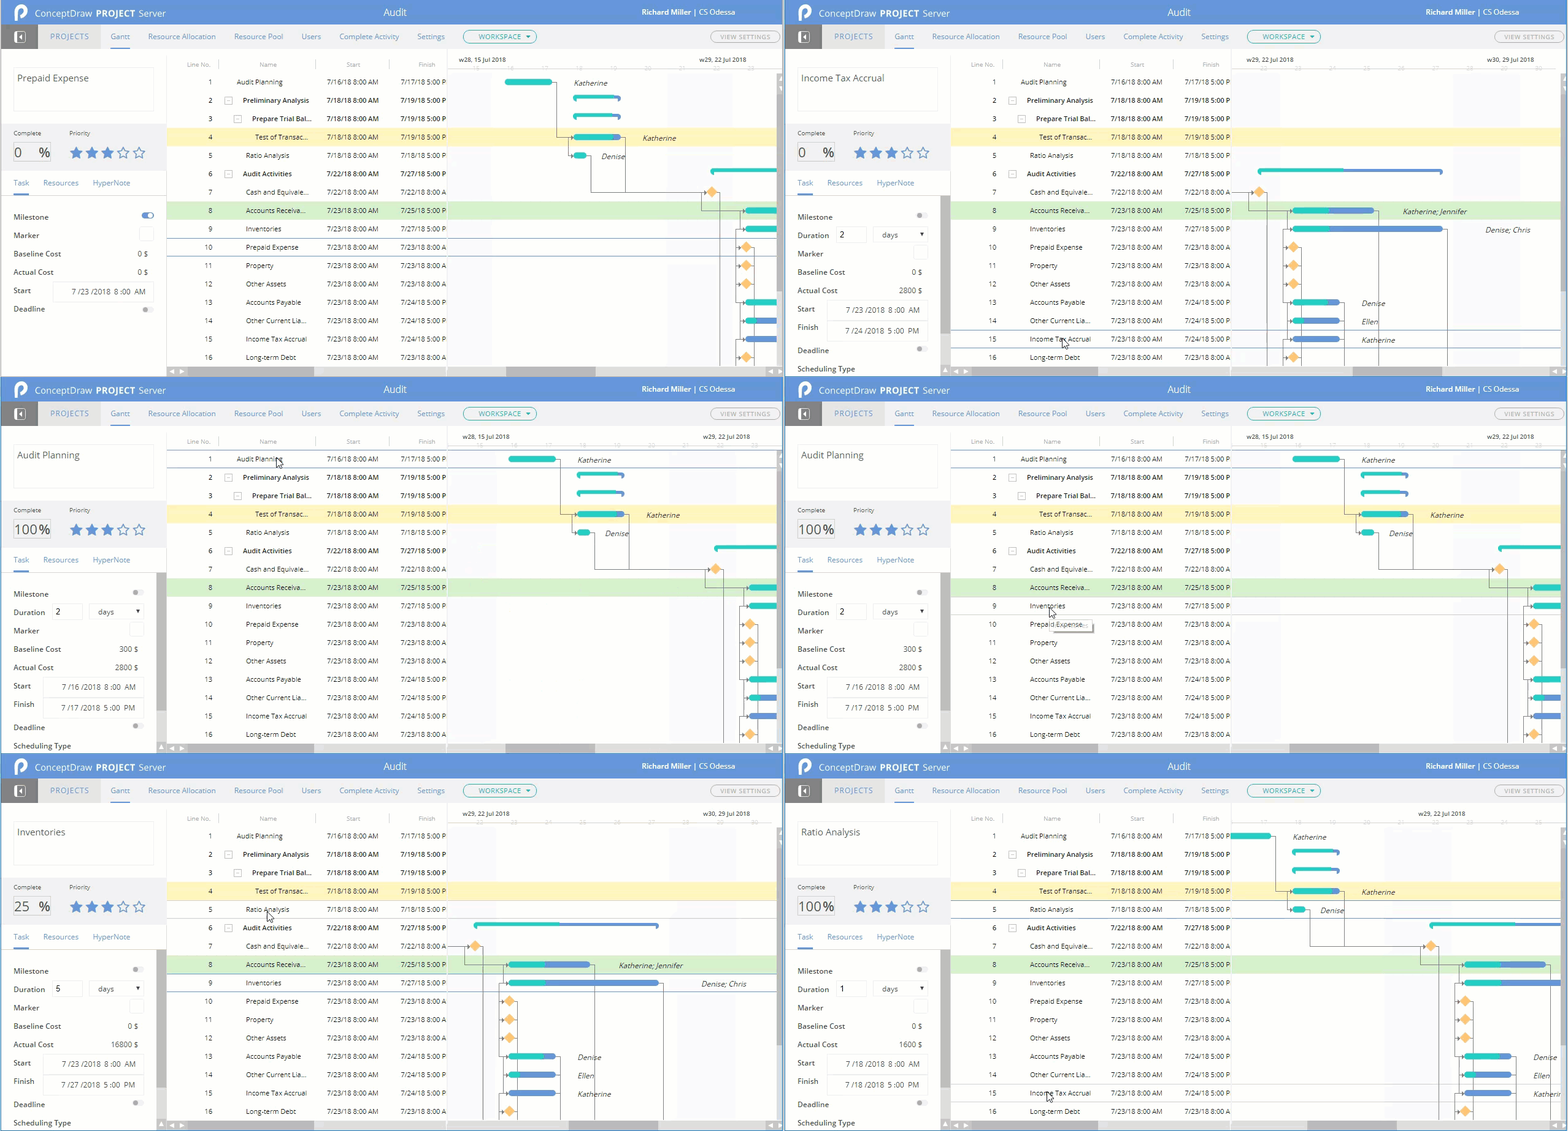
Most views in ConceptDraw PROJECT Server have a timescale that shows the units of project time measurement (hour, day, week, etc.) used to schedule project tasks. You can change the timescale to view smaller or bigger time units, from hours all the way up to years. For example, you may want to show time in quarterы of the yearб or you may want to show a Gantt chart across months and days.- Online Visio Viewer
- Diagram Viewer Online Help | Visio Files and ConceptDraw ...
- Visio Top View Rack
- Diagram Viewer Online Help | How to Open Visio ® VDX File Using ...
- Edit Visio Online
- Diagram Viewer Online Help | ConceptDraw PRO Compatibility with ...
- Diagram Viewer Online Help | Visio Exchange | In searching of ...
- Fault Tree Diagram | MS Visio Look a Like Diagrams | ConceptDraw ...
- How To Create a MS Visio Business Process Diagram Using ...
- What Can Be Used To View Visio Files On Mac
- Diagram Viewer Online Help | How to Open MS Visio ® 2013/2016 ...
- Mac Free View Visio Files
- Diagram Viewer Online Help | How to Convert MS Visio ® 2003 ...
- Swim Lane Diagrams | MS Visio Look a Like Diagrams | Swim ...
- CS Odessa Releases Its First iPad App - Diagram Viewer
- How to Open MS Visio ® 2013/2016 Files on a Mac® | ConceptDraw ...
- System Context Diagram Visio
- Visio Examples Process Flow With Swim Lanes
- Visio Network Diagram Storage


