Softness Presentation
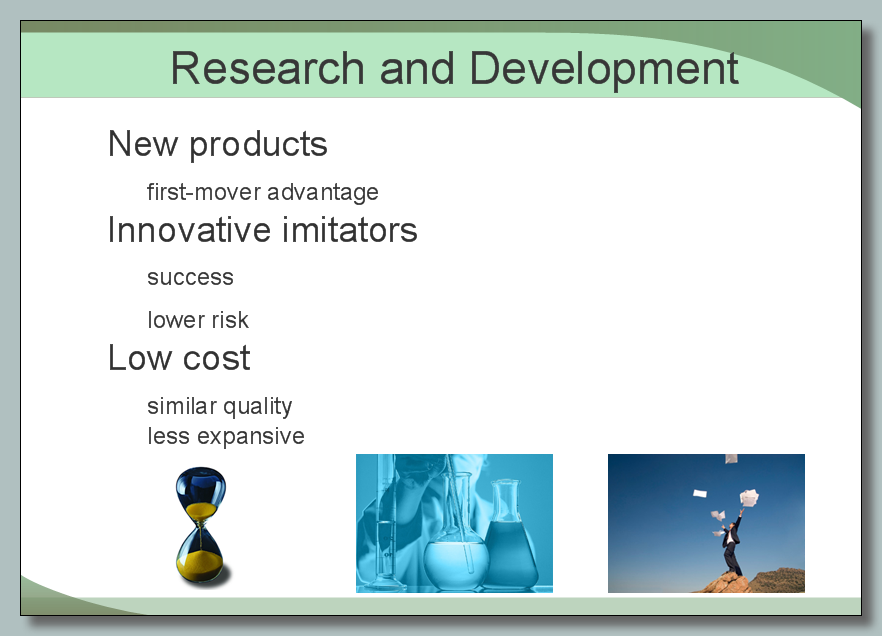
The choice of appropriate style is very important moment in preparation and planning the presentation. There are many possible presentation styles – from the elegant black-white graphics made from slides to complex 3D multimedia presentations with effects, animation and music. The choice of style depends on your audience, objectives, content of speech, the budget, time and used software. If the content of your speech is formal, contains a progress report or depicts financial status of the firm, or if you talk with a huge audience of strangers, the style of presentation needs to be the same and to correspond to importance of event. But if all present are familiar to you and their number is small, it is permissible to deviate slightly from the formal speech for better perception. ConceptDraw MINDMAP is ideal software for creation attractive presentations. Choose the style of presentation so that the key points of your speech were saved in memory of audience. Use all your creativity to create a memorable presentation, effective tools for this are already provided by ConceptDraw MINDMAP. Designed presentation with softness style contains illustrations and notes from Mind Map document.SWOT Analysis
Most of the data needed for market analysis (demand, prices, volume of sales, etc.) are undefined, and in future are possible their changes as in the worst and the best side. SWOT analysis is effective method for prediction these processes and decision making for organizations that function in a competitive environment. It allows you to see the whole situation, to identify the strengths and weaknesses of organization (advantages and disadvantages), as well as opportunities and threats of external environment. The results of SWOT analysis are the basis for optimization the business processes, for development by the leading specialists in organization of interrelated complex of strategies and competitive activities. ConceptDraw DIAGRAM software enhanced with SWOT and TOWS Matrix Diagrams Solution will effectively help you in strategic planning for your company, department, project, in development marketing campaign, in identification of four categories of factors of internal and external environment of organization, and construction professional-looking SWOT and TOWS matrices.Competitor Analysis
Competitor analysis is a first and obligatory step in elaboration the proper corporate marketing strategy and creating sustainable competitive advantage. Use powerful opportunities of numerous solutions from ConceptDraw Solution Park for designing illustrative diagrams, charts, matrices which are necessary for effective competitor analysis.7 Management & Planning Tools
The 7 Management and Planning Tools solution available from ConceptDraw Solution Park implements well-known methodologies and provides the comprehensive set of tools for problems' analysis and solving. Different products from multifunctional ConceptDraw Office suite may be used as a complete solution for any of methodologies offered by this solution and provide a visual communication during every stage of work. Use the MINDMAP 7 Management & Planning Tools for step-by-step identification and analysis the problems, for planning solving and corrective actions, and also countermeasures to address the risks. 7 Management and Planning Tools solution is perfect for managers in medium to large companies, who require effective tools to address the management issue, for business consultants, trainers and coaches to help visualize the problem's solving by using 7 MP Tools methodology, to structure the problem's affecting factors, analyze their root causes and cause and effect relations, to highlight drivers and indicators factors, to prioritize factors using ranking by criteria set.The Sales Process
The Sales Process is a complex approach for selling a product or service which assumes many steps including the sales planning, realization of the sales marketing and management strategies, sales process analysis, etc. Now we have a ConceptDraw DIAGRAM software extended with unique Sales Flowcharts solution from the Marketing area of ConceptDraw Solution Park which ideally suits for the planning and realization the company's sales process.Remote Projects in Corporate Strategy
Communication is the main challenge and the key success factor for organizational project management in company with remote projects. Communicating visually via Skype you bring all projects together to achieve corporate goals.
Relations Diagram
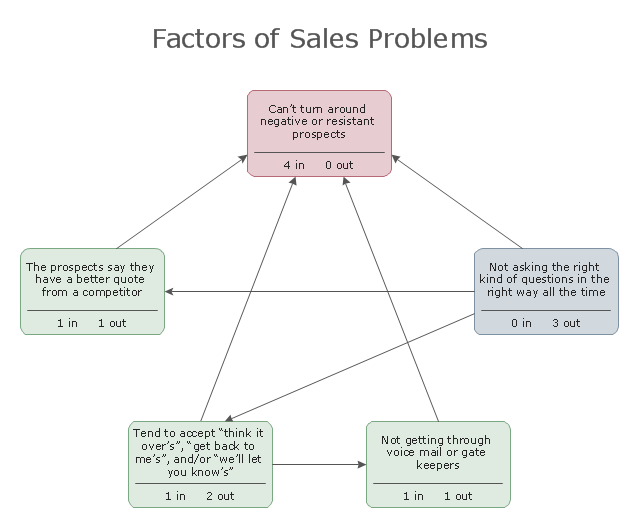
Relations Diagram was first used in electronics industry with a goal to find the key words and phrases in a text, and now is used in variety of fields. Relations Diagram defines visually the complex relationships between different elements and uses the boxes to represent these elements and the arrows to show the links. Relations Diagram allows the most extensively consider the problems, to represent visually relationships between the factors, processes, areas. It can be effective in organizing the diversity of ideas generated during the brainstorming session, lets identify the causes factors called "Drivers" and effects factors called "Indicators", detect such important characteristics as Key Performance Indicators that help to monitor the changes and effectiveness of corrective actions in the process of problem solving. ConceptDraw MINDMAP and ConceptDraw DIAGRAM applications that are included to ConceptDraw suite, offer a lot of useful tools that help perform the brainstorm session and easy design Relations Diagram. To make effectively Relations Diagram simply identify the problem, capture the issues, draw the arrows and count the influencers.Root Cause Tree Diagram
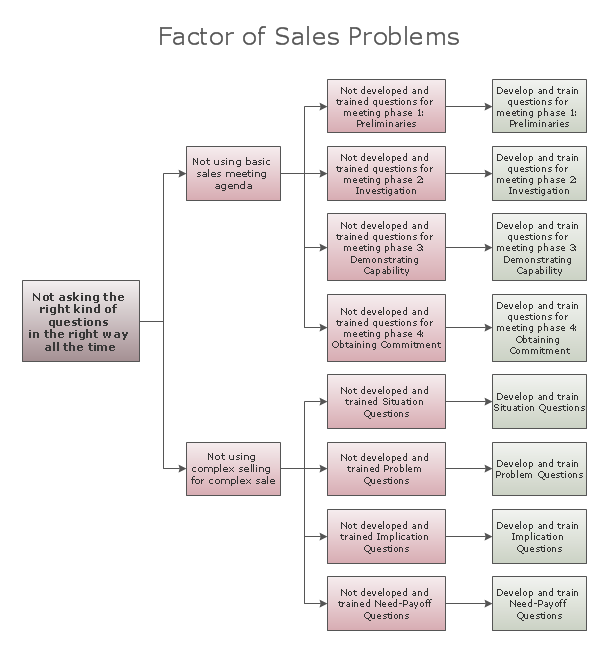
Root Cause Tree Diagram is one of the best tools to outline the problems and their causes, to analyze them and to formulate the possible corrective actions. Root Cause Tree Diagrams are successfully used in management, marketing, quality control and depth analysis, and are based on the principle that solution of any problem is concentrated at the root. Root Cause Tree Diagram contains the main problem on the top, from the top depart two branches of causes, which then diverge on additional causes, thus is constructed the hierarchy of root causes. So, the step by step defining of causes lets to detect the main reasons of a given effect and to make the correct arrangements to solve a problem. The ConceptDraw MINDMAP and ConceptDraw DIAGRAM products included to ConceptDraw Office suite, with help of Business Productivity solutions from the ConceptDraw Solution Park are effective in questions of problem solving, defining root causes of various problems, root causes analysis and designing the Root Cause Tree Diagrams.Pyramid Diagram
Pyramid chart example is included in the Pyramid Diagrams solution from Marketing area of ConceptDraw Solution Park.- Relationship Between Brand Strategies Which Is Brand Pyramid
- Food infogram - Reducing sodium | Activities calendar - FEMA ...
- Bubble Diagrams | Best Multi-Platform Diagram Software | Idea ...
- Competitor Analysis | Target and Circular Diagrams | Circle-Spoke ...
- Seven Basic Tools of Quality | SWOT Analysis | Bubble Diagrams ...
- Bubble Diagrams | C4ISR architecture framework - IDEF0 activity ...
- Strategy Map | Balanced scorecard strategy map | Build Strategies ...
- Pyramid Chart Examples | Defensive Strategy Diagram – 46 ...
- Bubble Chart | Bubble Diagrams | Gym and Spa Area Plans | Health ...


