"A performance indicator or key performance indicator (KPI) is a type of performance measurement. An organization may use KPIs to evaluate its success, or to evaluate the success of a particular activity in which it is engaged. Sometimes success is defined in terms of making progress toward strategic goals, but often success is simply the repeated, periodic achievement of some level of operational goal (e.g. zero defects, 10/ 10 customer satisfaction, etc.). Accordingly, choosing the right KPIs relies upon a good understanding of what is important to the organization. 'What is important' often depends on the department measuring the performance - e.g. the KPIs useful to finance will be quite different from the KPIs assigned to sales. Since there is a need to understand well what is important (to an organization), various techniques to assess the present state of the business, and its key activities, are associated with the selection of performance indicators. These assessments often lead to the identification of potential improvements, so performance indicators are routinely associated with 'performance improvement' initiatives." [Performance indicator. Wikipedia]
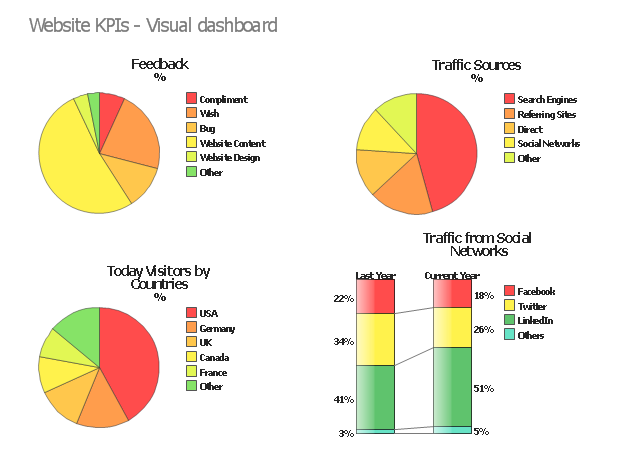
The example "Website KPIs - Visual dashboard" was created using the ConceptDraw PRO diagramming and vector drawing software extended with the Composition Dashboard solution from the area "What is a Dashboard" of ConceptDraw Solution Park.
The example "Website KPIs - Visual dashboard" was created using the ConceptDraw PRO diagramming and vector drawing software extended with the Composition Dashboard solution from the area "What is a Dashboard" of ConceptDraw Solution Park.
A KPI Dashboard Provides the Answers Your Sales Team
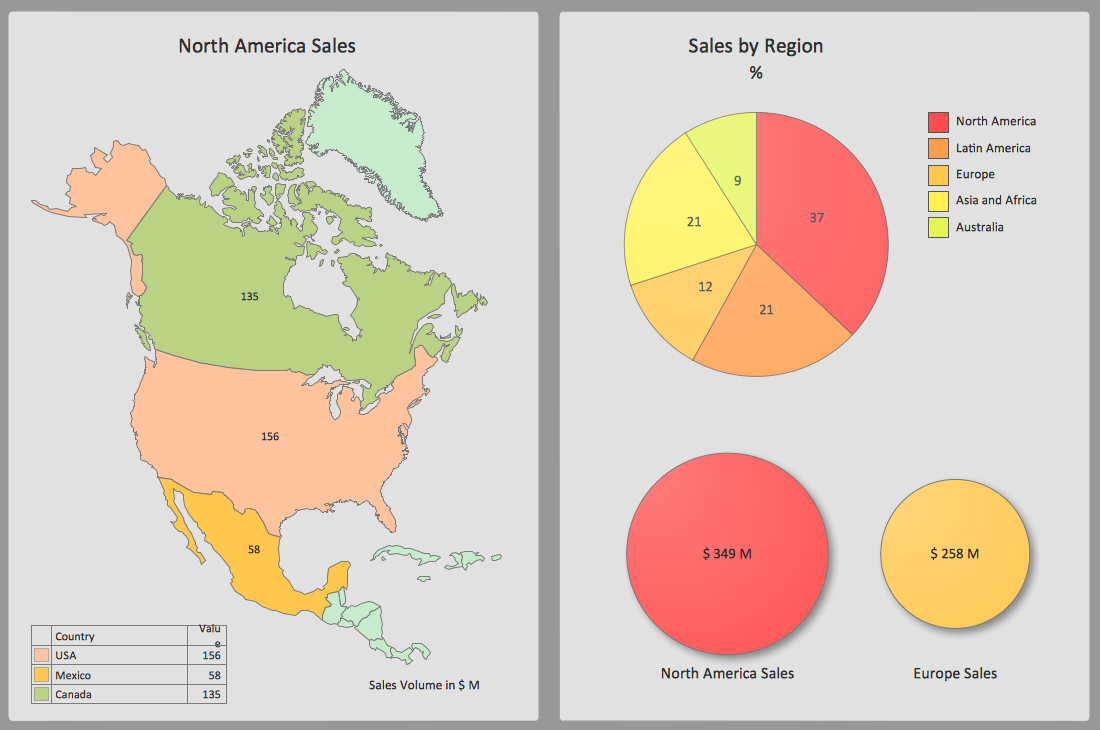
Sales dashboard is a tool that provides the answers to all questions your sales team may have. A mature sales dashboard provides complete set of KPI to shows corporate, team or personal performance to keep sales process clear.ConceptDraw MINDMAP: Brainstorming, Mind Mapping for macOS and Windows
ConceptDraw MINDMAP is a powerful business and personal productivity software application that provides visual organization and access to information for individuals and organizations.Sales Dashboard Examples
Visualizing sales data you may need a good example to start. ConceptDraw Sales Dashboard solution delivers a complete set of templates and samples you can use as examples to start composing your own sales dashboard.Root Cause Analysis
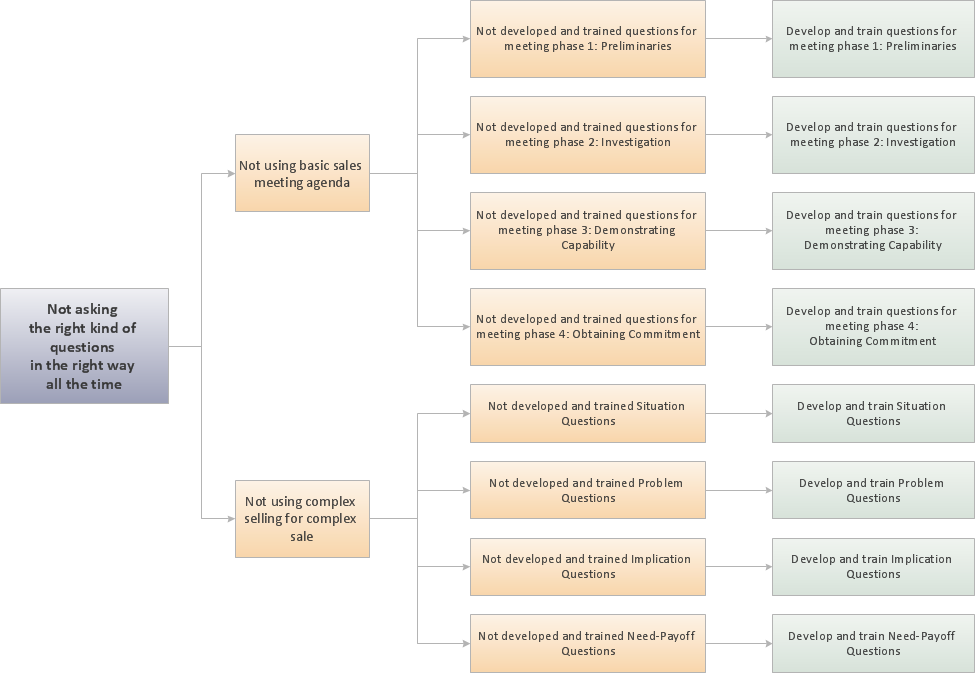
The Seven Management and Planning Tools is a tool for Root Cause Analysis Tree Diagram drawing. This diagram is for Root Cause Analysis. Analyze the root causes for factors that influenced the problem. This diagram is constructed separately for each highly prioritized factor. The goal of this is to find the root causes for the factor and list possible corrective action.
Project — Assigning Resources
Users new to ConceptDraw PROJECT will find the Basic lessons an essential platform for familiarizing themselves with the program′s functions. Learn how to assign resources to tasks in ConceptDraw PROJECT with this comprehensive video lesson.
Project — Working With Tasks
A full-featured project management solution with all the necessary functions right at your fingertips. Generates an extensive variety of reports on project and task statuses. These videos provide a series of lessons that will enhance the understanding of all our users, from people just starting out with the software, through to expert users.
 Stakeholder Onion Diagrams
The Stakeholder Onion Diagram is often used as a way to view the relationships of stakeholders to a project goal. A basic Onion Diagram contains a rich information. It shows significance of stakeholders that will have has influence to the success achieve
- Performance Indicators | Constant improvement of key performance ...
- Enterprise dashboard | Meter Dashboard | Website KPIs - Visual ...
- The Facts and KPIs | KPIs and Metrics | Website KPIs - Visual ...
- Website KPIs - Visual dashboard | A KPI Dashboard Provides the ...
- Website KPIs - Visual dashboard | Area Charts | Sales Achievement ...
- Website metrics - Visual dashboard | Website traffic dashboard ...
- A KPI Dashboard | A KPI Dashboard Provides the Answers Your ...
- Sales metrics and KPIs - Visual dashboard | Website KPIs - Visual ...
- Cross-functional flowchart Templates portrait, metric | Sales metrics ...
- Virtuous circle (management) - Ring chart | Website KPIs - Visual ...
- Website metrics - Visual dashboard | Website traffic dashboard ...
- Sales KPI Dashboards | A KPI Dashboard Provides the Answers ...
- Enterprise dashboard | KPI Dashboard | Time Series Dashboard ...
- KPIs and Metrics | Correlation Dashboard | Strategy Map | Business ...
- Design elements - Sales KPIs and metrics | Goal Vs Actual ...
- Design elements - Meter indicators
- Sales metrics and KPIs - Visual dashboard | Sales dashboard ...
- Sales metrics and KPIs - Visual dashboard | What is a KPI ...
- Design elements - Status indicators | Design elements - Meter ...


