HelpDesk
How to Use ConceptDraw Dashboard for Facebook on OS X
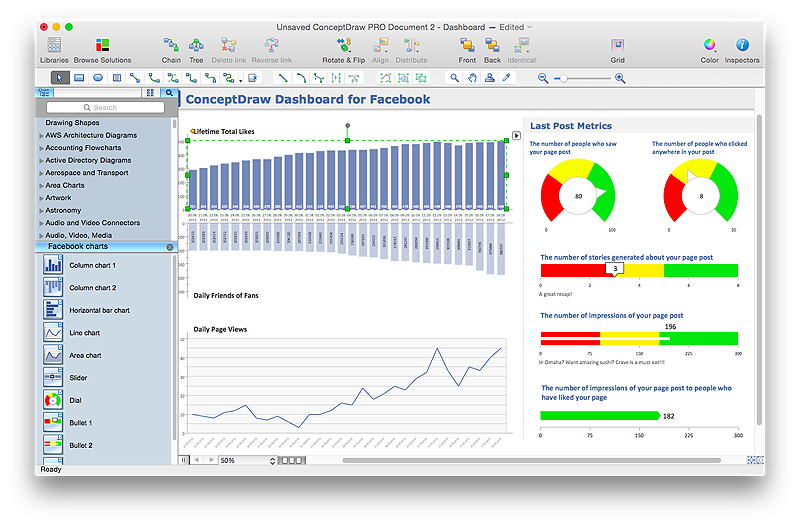
The ConceptDraw Dashboard for Facebook Solution is a visual dashboard that visualizes lifetime total Likes, daily Friends of Fans, and daily Page views based on the information exported from your Facebook Page.
 What is a Dashboard Area
Solutions from the area What is a Dashboard of ConceptDraw Solution Park collects templates, samples and vector stencils libraries with of data driven charts and indicators for drawing the basic types of Visual Dashboards.
HelpDesk
How to Connect Tabular Data (CSV) to a Graphic Indicator on Your Live Dashboard
The Time Series Dashboard Solution can be used to create the interactive Time Series Charts as Column Charts, Line Charts, or Bar Charts for your interactive dashboard.
 ConceptDraw Dashboard for Facebook
ConceptDraw Dashboard for Facebook solution extends ConceptDraw PRO software with a dynamically updated visual dashboard, which shows lifetime total likes, daily friends of fans, and daily page views, information you can receive from Facebook Insights.
 Composition Dashboard
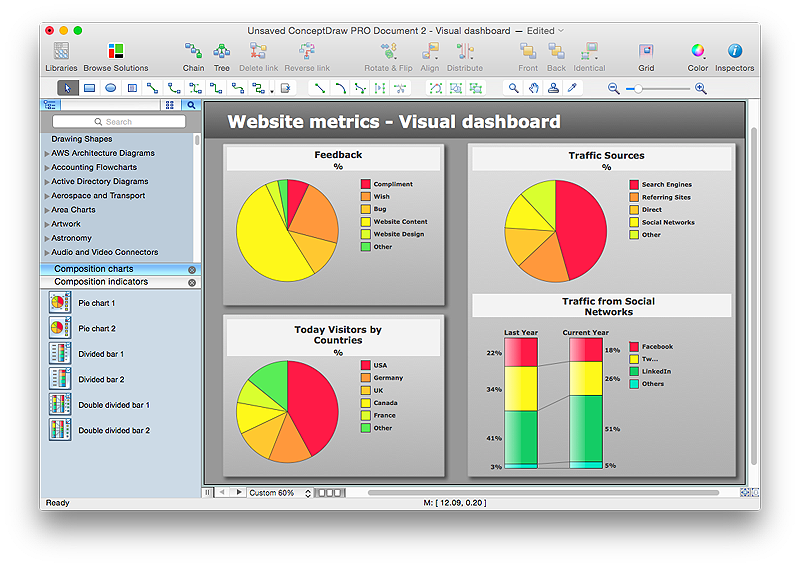
Composition dashboard solution extends ConceptDraw PRO software with templates, samples and vector stencils library with charts and indicators for drawing visual dashboards showing data composition.
 Comparison Dashboard
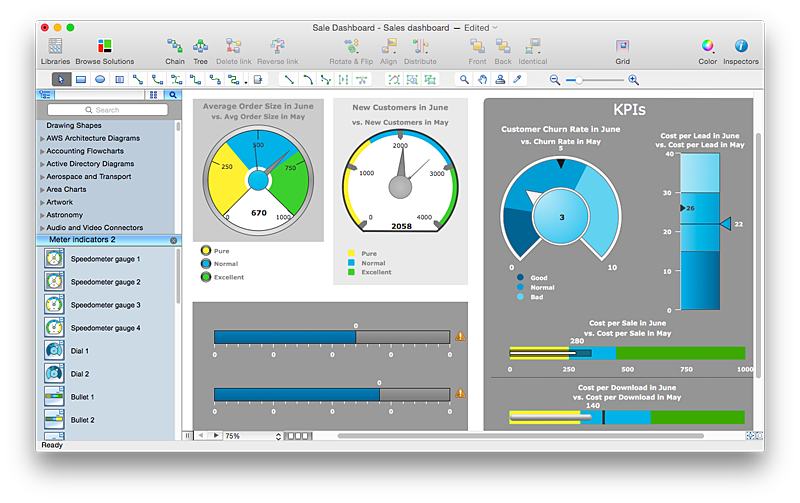
Comparison dashboard solution extends ConceptDraw PRO software with samples, templates and vector stencils library with charts and indicators for drawing the visual dashboard comparing data.
HelpDesk
How to Connect a Live Object to a Text Data Source
Instruction on how to connect a ConceptDraw live object with data source files in TXT format to visualize the actual values of your performance metrics.
 Status Dashboard
Status dashboard solution extends ConceptDraw PRO software with templates, samples and vector stencils libraries with graphic indicators for drawing the visual dashboards showing status data.
 What are Infographics Area
Solutions of the area What is Infographics from ConceptDraw Solution Park collect templates, samples and vector stencils libraries with design elements for the drawing information graphics.
- Engineering Kpi Dashboard
- Design elements - Composition charts and indicators | Bargraph ...
- Design elements - HR department | Human Resource Development ...
- Design elements - Comparison charts and indicators | Design ...
- Design elements - Meter indicators
- Design elements - Meter indicators
- Meter Dashboard | Design elements - Meter indicators | Meter ...
- Instruments - Vector stencils library | Meter Dashboard | Meter ...
- Indicators Of Electrical Layouts
- Project tasks dashboard | Design elements - Meter indicators ...
- Indicator Png
- Design elements - Meter indicators | Event-driven Process Chain ...
- Sales metrics and KPIs - Visual dashboard | Website KPIs - Visual ...
- Management indicators - Vector stencils library | Sales performance ...
- Indicator Meter Diagram
- Website traffic dashboard | Status indicators - Vector stencils library ...
- How Much Dia Of Pie Indicator
- Balanced Scorecard Software | ConceptDraw Solution Park | Design ...
- Png Indicator
- Meter indicators 2 - Vector stencils library | Instruments - Vector ...


