PROBLEM ANALYSIS. Root Cause Analysis Tree Diagram
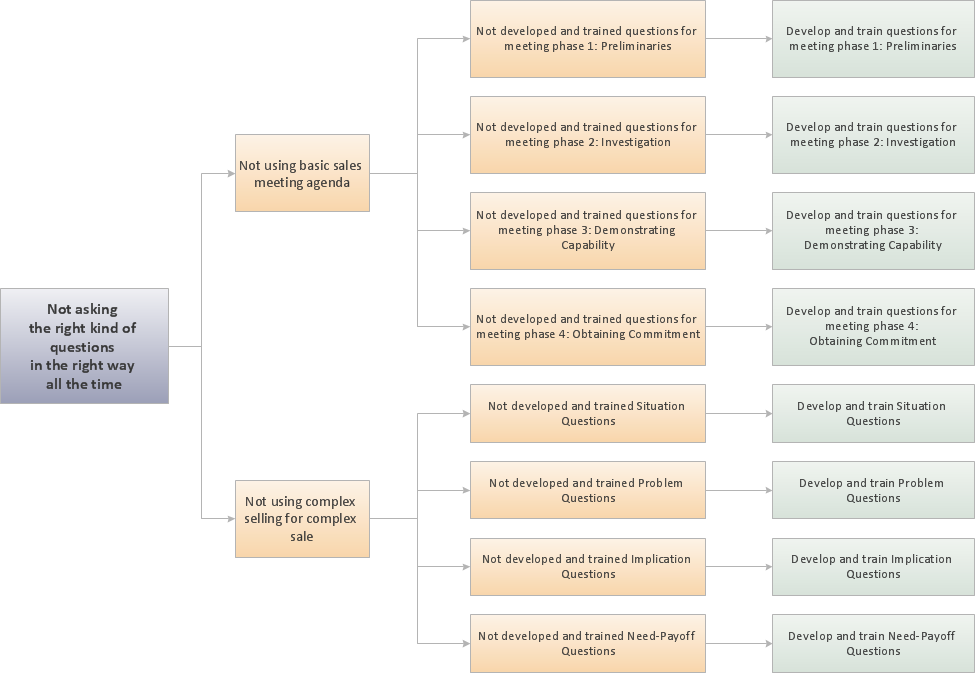
Root Cause Analysis Tree Diagram. Use the Root Cause Diagram to perform visual root cause analysis. Root Cause Analysis Tree Diagram is constructed separately for each highly prioritized factor. The goal of this is to find the root causes for the factor and list possible corrective action.ConceptDraw Office suite is a software for problem analysis.

 Management
This solution extends ConceptDraw PRO v9 and ConceptDraw MINDMAP v7 with Management Diagrams and Mind Maps (decision making, scheduling, thinking ideas, problem solving, business planning, company organizing, SWOT analysis, preparing and holding meetings
HelpDesk
How to Manage Problem Solving Using Seven Management and Planning Tools
Stage by stage gouide on using visual tools to move toward solving the problem.
Bar Diagrams for Problem Solving. Create event management bar charts with Bar Graphs Solution
Create bar charts for event management problem solving and visual data comparison using the ConceptDraw PRO diagramming and vector drawing software extended with the Bar Graphs Solution from the Graphs and Charts area of ConceptDraw Solition Park.Visual Presentations Made Easy with Diagramming Software
Automatically create a presentation-quality diagram in one click with ConceptDraw PRO.
HelpDesk
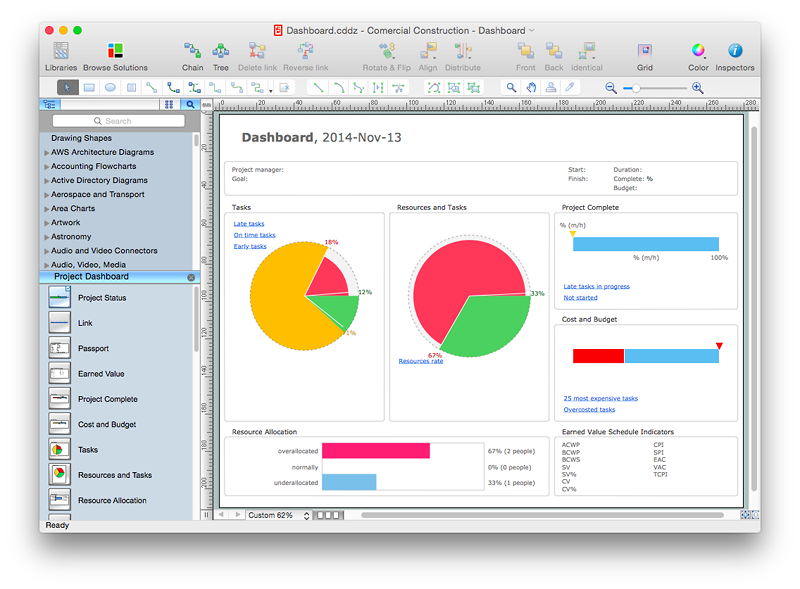
How to Create Project Dashboard on Mac
The visual Project Dashboard within ConceptDraw Office is the best way to deliver a clear view of project performance to all project participants.Decision Making
Decision Making - ConceptDraw Office suite provides visual tools that are given support on the stage of the decision making.The Seven Management and Planning Tools is a set for such diagrams: Affinity Diagram, Relations Diagram, Prioritization Matrix, Root Cause Tree Diagram, Involvement Matrix, PERT Chart, Risk Diagram (PDPC).

Presentations in Educational Process
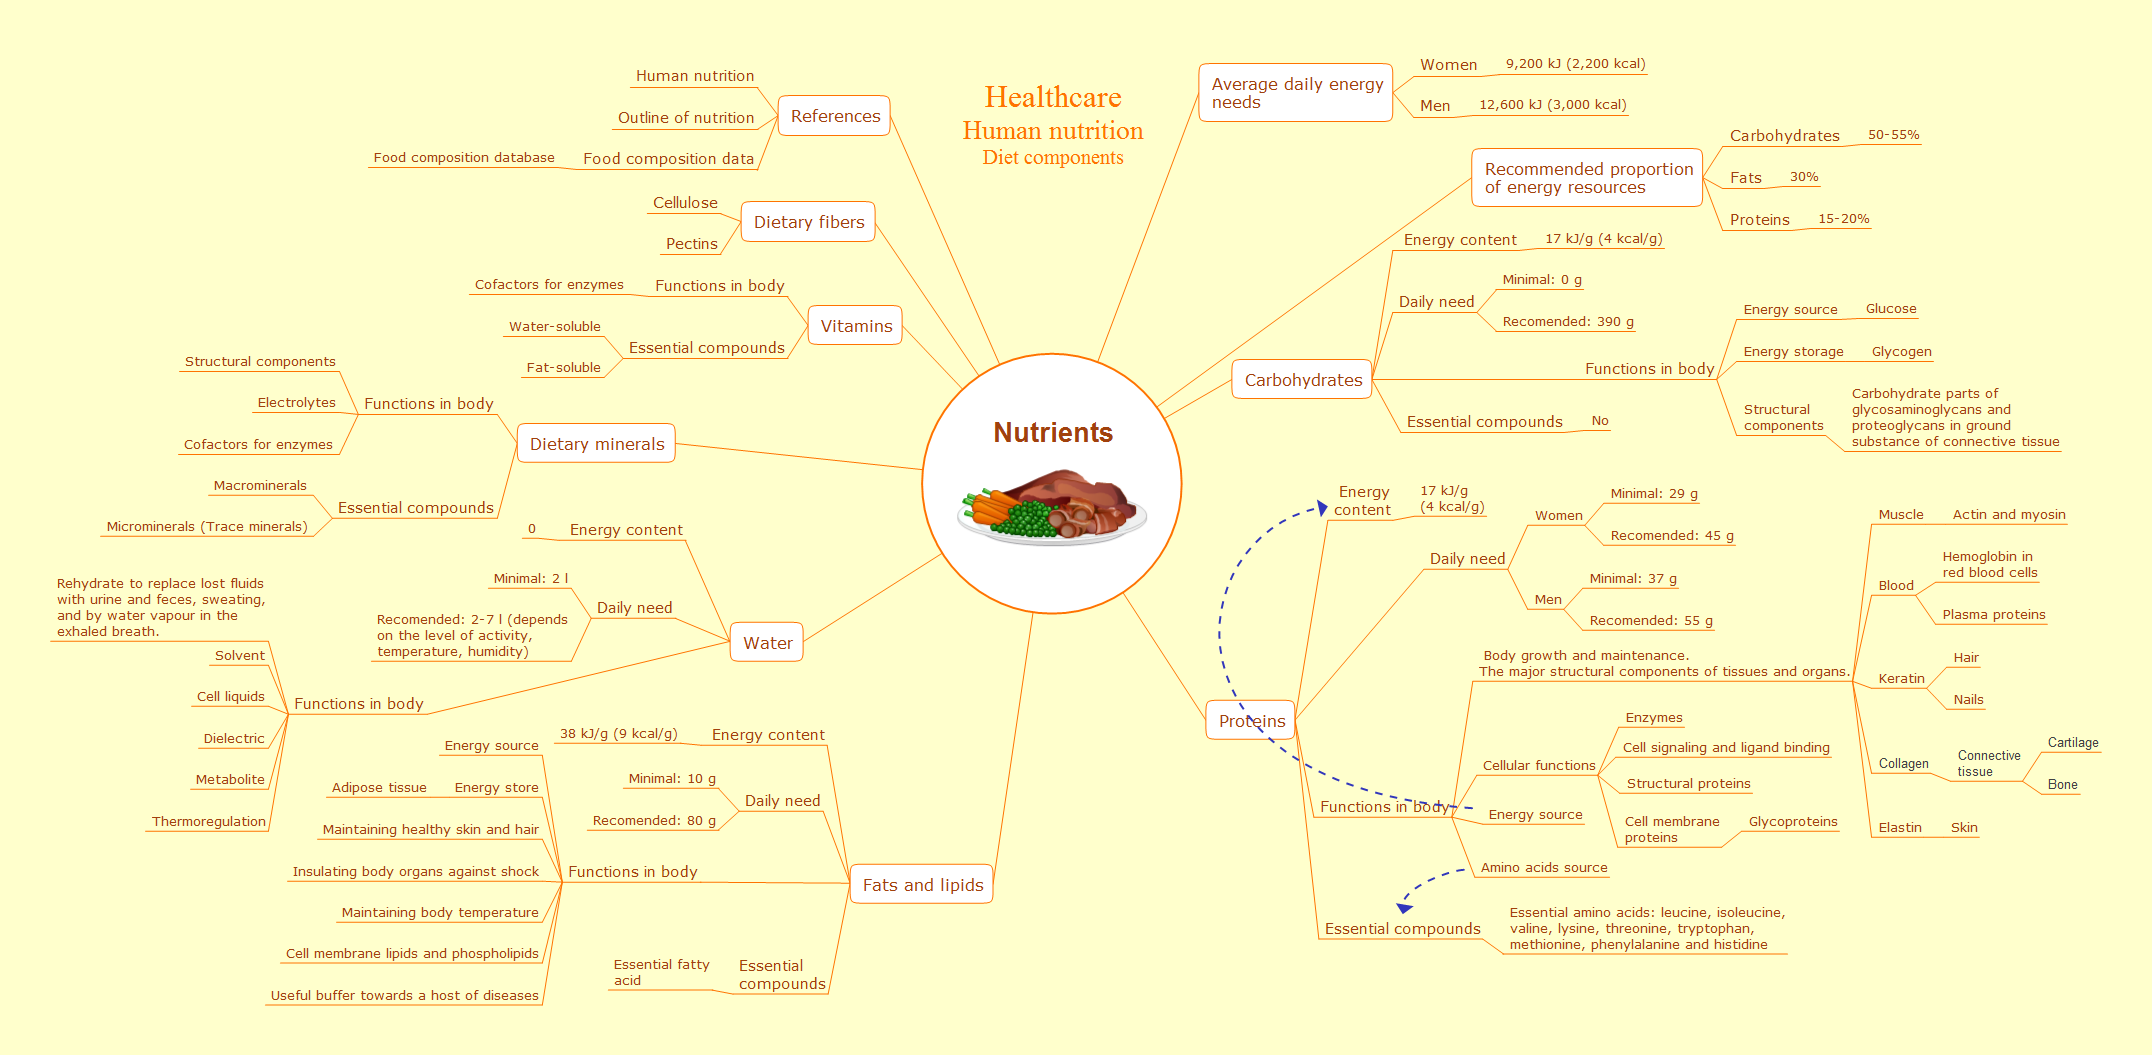
Using mind mapping in education is very popular way to make your lecture materials more structural and clear both for you and for students. At remote learning session your students also can make notes or type questions to the current slides without interrupting slide show.
HelpDesk
How to Use ConceptDraw Sales Dashboard Solution
The interactive visual dashboard is a valuable tool for any sales team. Sales dashboard allows you to view and monitor sales indicators that are important for manager and sales staff . It helps to use the timely and reliable information to improve the quality of sales performance and increase sales revenues. ConceptDraw Sales Dashboard solution is a tool for both: sales manager and sales team. It provides the visualization of key performance indicators that are critical to the entire sales organization. The custom sales dashboard displays the real-time information on sales performance KPIs with the help of intuitive and easy-to-understand diagrams and charts. Sales Dashboard helps the entire team see where they are, and what needs to be done. With ConceptDraw PRO you can easily create a visual Sales Dashboard using Live Objects Technology.
Root Cause Analysis
The Seven Management and Planning Tools is a tool for Root Cause Analysis Tree Diagram drawing. This diagram is for Root Cause Analysis.Analyze the root causes for factors that influenced the problem. This diagram is constructed separately for each highly prioritized factor. The goal of this is to find the root causes for the factor and list possible corrective action.

 PM Easy
This solution extends ConceptDraw PROJECT software with the ability to quickly start a project; it lists task relationships and dependencies to make iterative planning easy.
TQM Diagram Example
The Total Quality Management Diagram solution helps you and your organization visualize business and industrial processes. Create Total Quality Management diagrams for business process with ConceptDraw software.How to Draw EPC Diagram Quickly
An event-driven process chain diagram is a flowchart used in business process analysis. It evolved from Architecture of Integrated Information Systems (ARIS) and utilised in the business process improvement and analysis. It is also used to facilitate enterprise resource planning.An EPC diagram is a complex flowchart that shows different business processes through various workflows. The workflows are seen as functions and events that are connected by different teams or people, as well as tasks that allow business processes to be executed.
ConceptDraw PRO is a software for making EPC diagrams that allows managers visually present business process models for making decisions for business.

Fundamental Tool in Quality Management
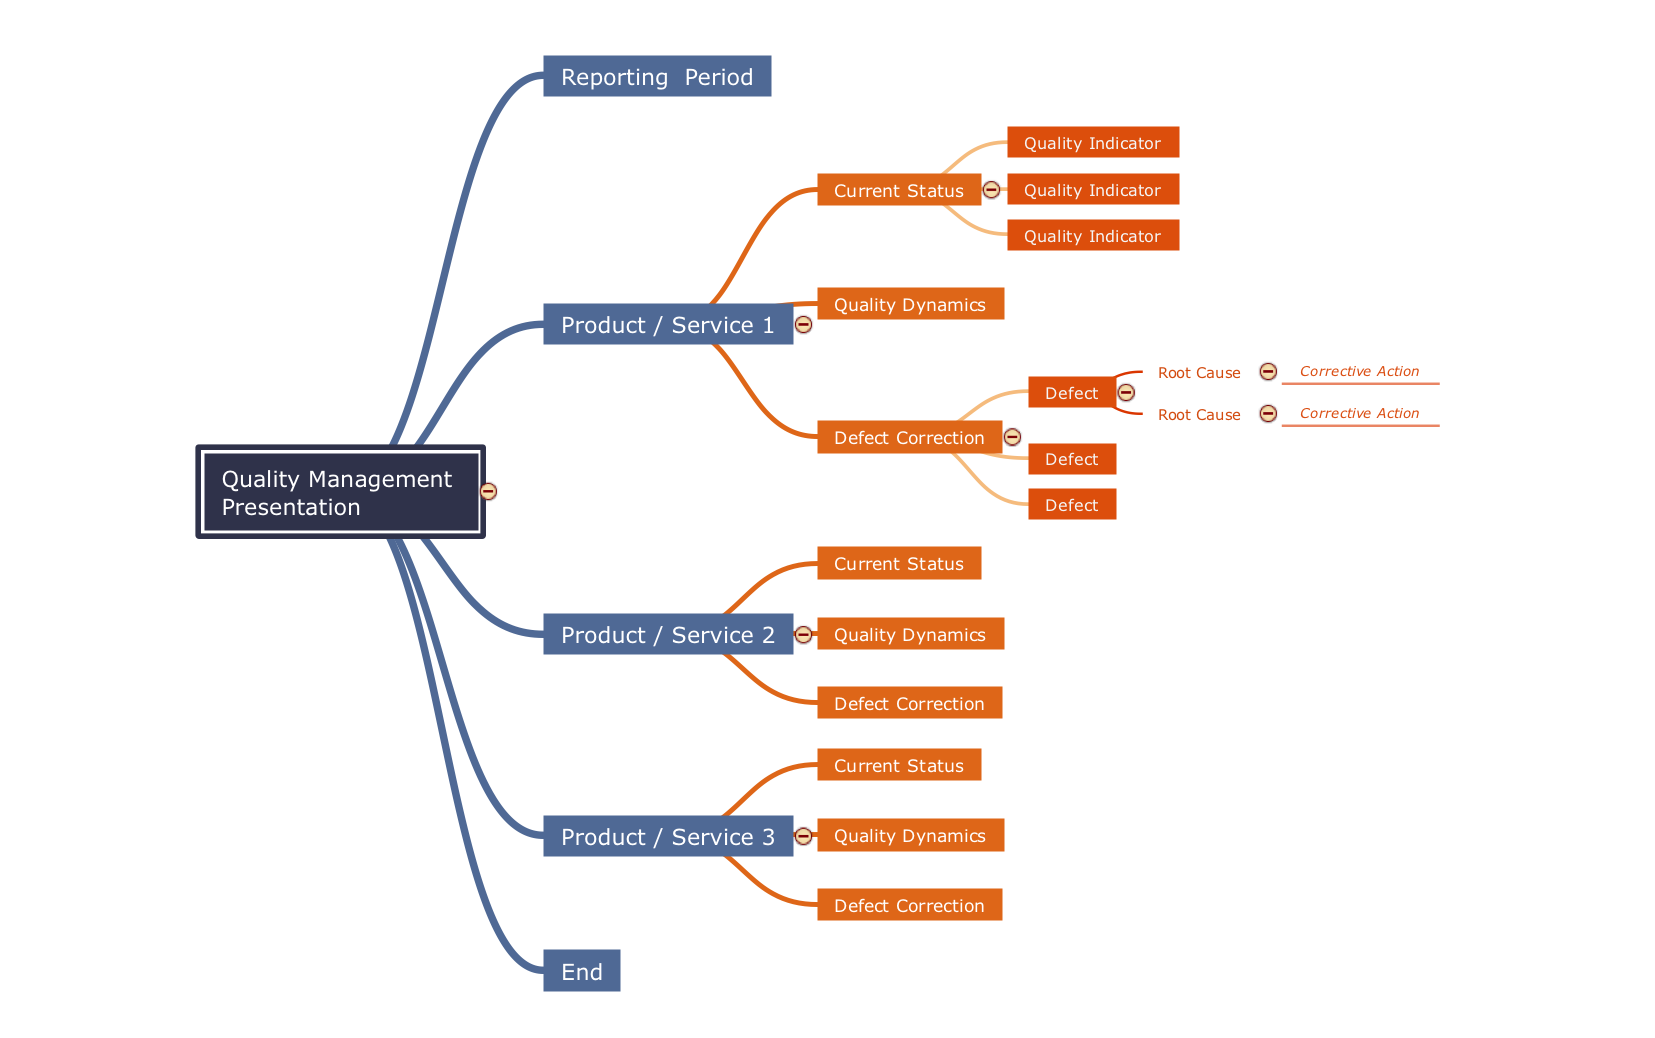
ConceptDraw MINDMAP is a fundamental tool in quality management to describe visual instructions on any process.- Visual Management Tools
- Total Quality Management TQM Diagrams | Quality Mind Map | How ...
- Human Resource Management | Hiring Process | Human Resource ...
- Total Quality Management TQM Diagrams
- How to Create Organizational Chart Using Management Solution ...
- Decision Making | Management | How to Create Organizational ...
- Computer Networking Tools List | Seven Management and Planning ...
- TQM Diagram Tool | Total Quality Management | How to Create a ...
- Process Flowchart | Engineering | Visual Presentations Made Easy ...
- Quality Management Tools | TQM Tools | Management Tools ...
- How to Create a TQM Diagram Using Total Quality Management
- Quality Management Teams | Quality Project Management with Mind ...
- How to Start Mind Mapping from a Custom Template | Create a ...
- How to Create a TQM Diagram Using Total Quality Management ...
- Seven Management and Planning Tools | PROBLEM ANALYSIS ...
- Seven Management and Planning Tools
- Network Diagram Of Project Management Solutions
- Visual Workflow Management
- Priority Management
- TQM Diagram — Professional Total Quality Management | Constant ...


