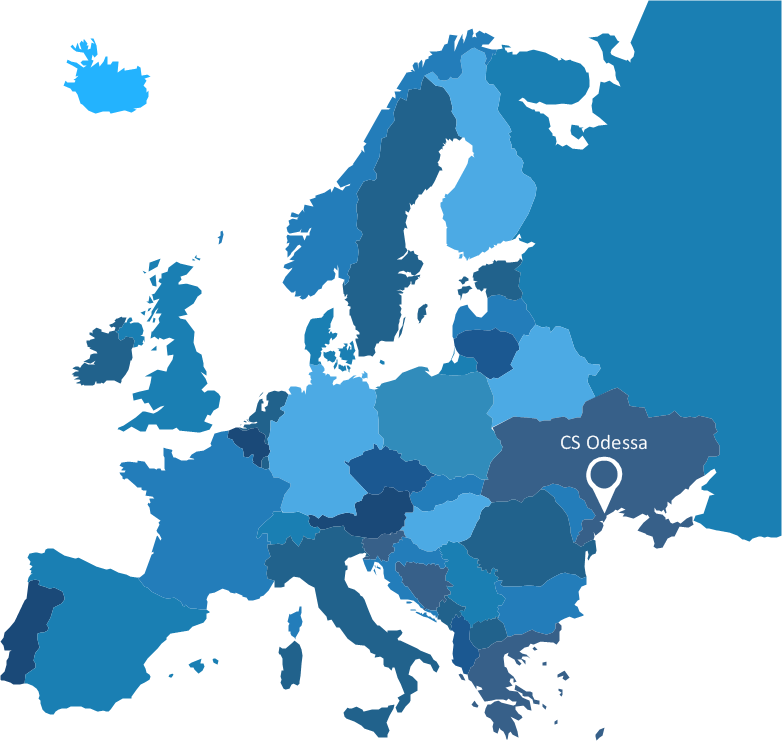
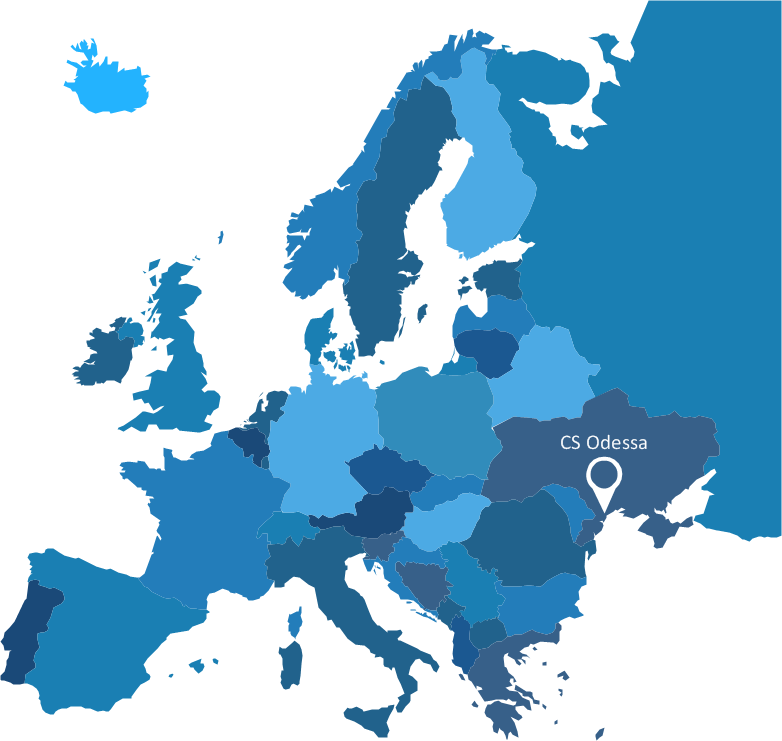
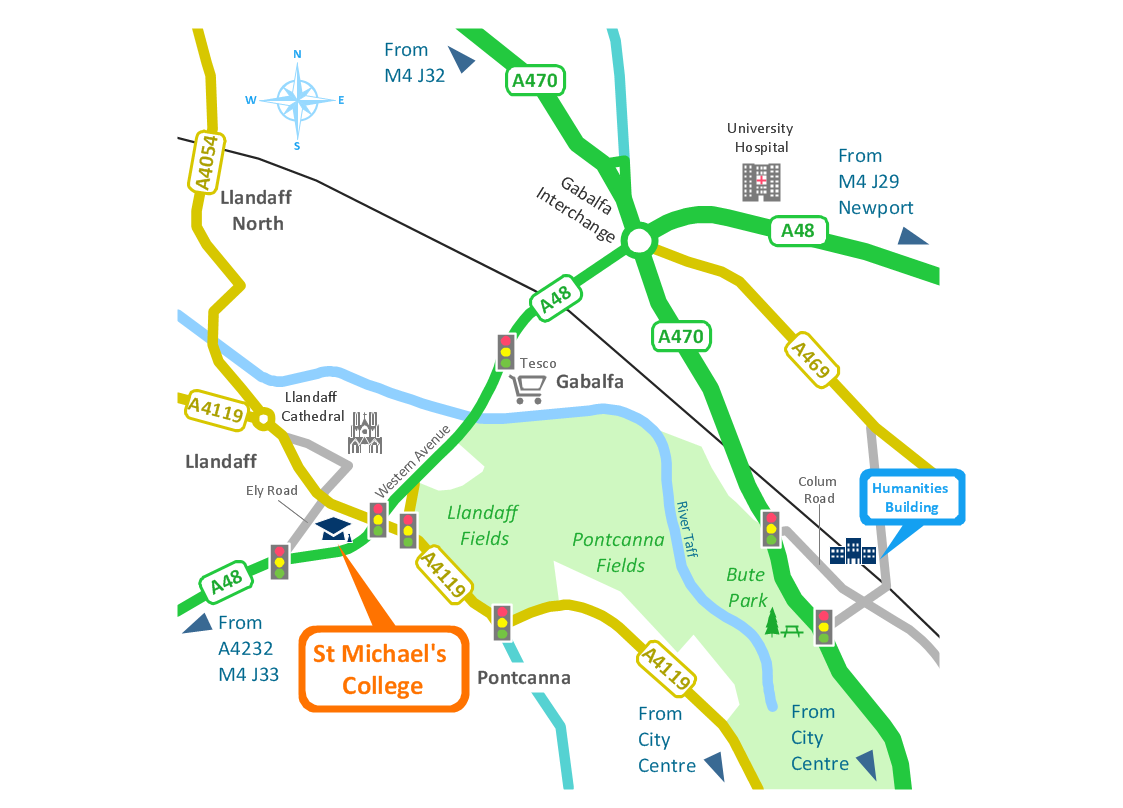
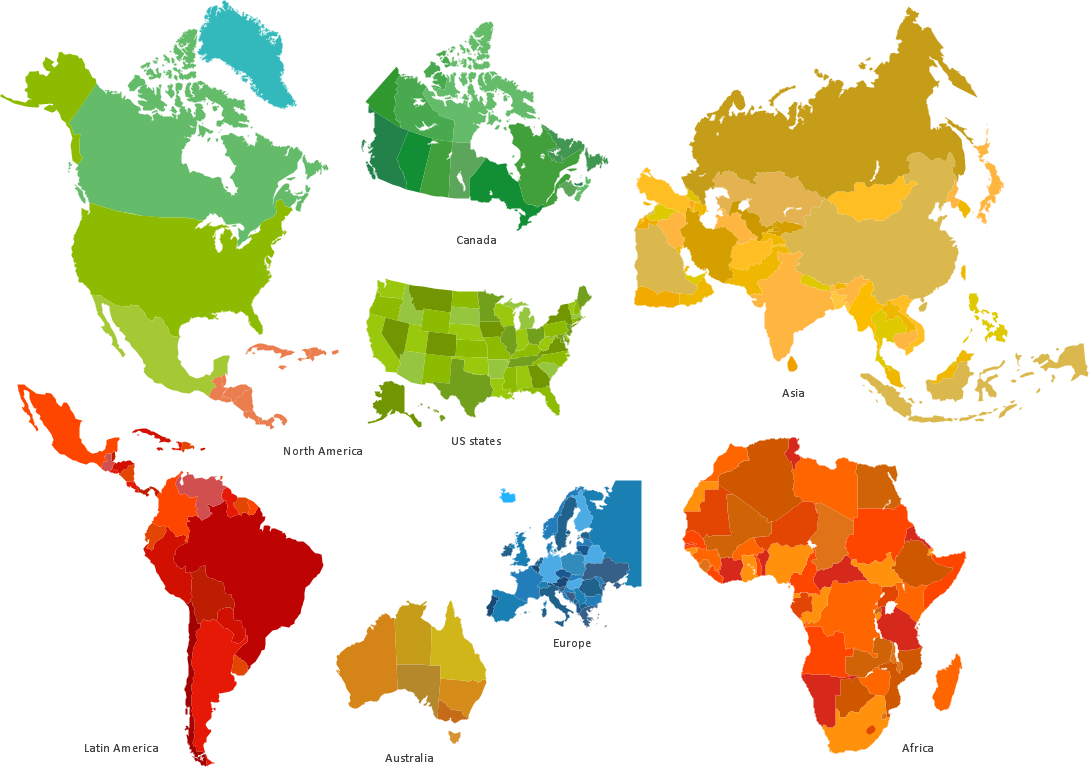
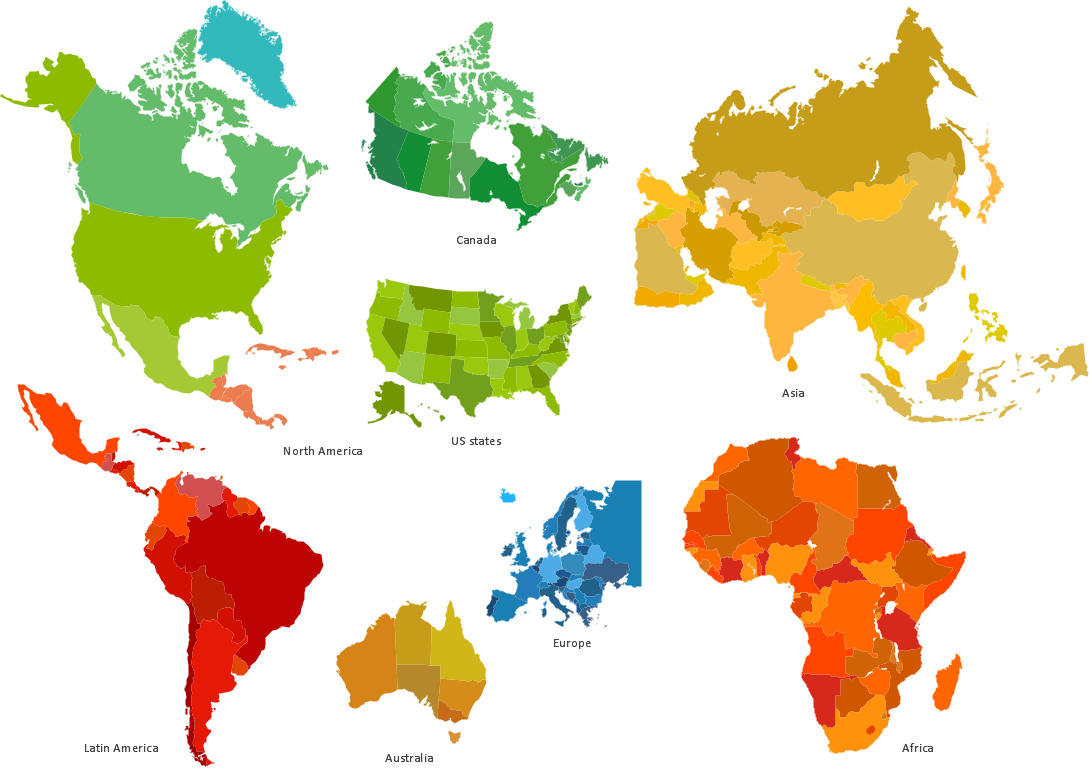
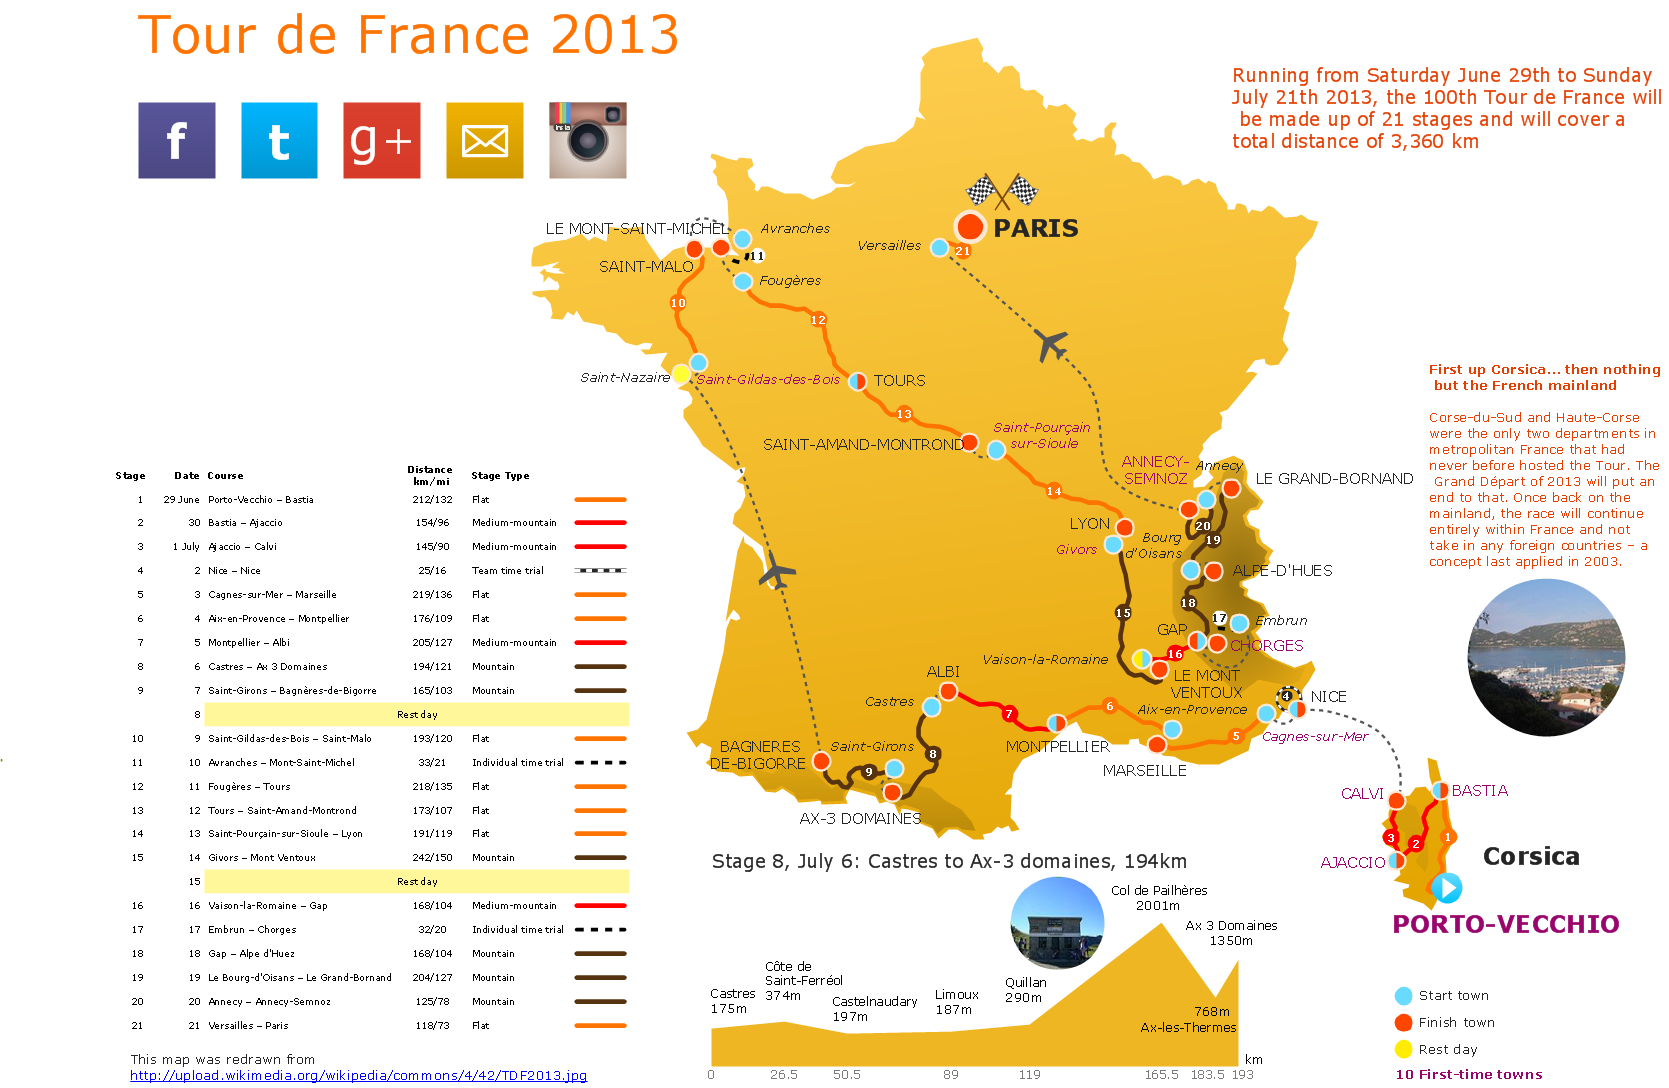
Visualization Spatial Data Using Thematic Maps Combined with Infographics
Now anyone can build an infographics from their data using ConceptDraw.Nice and simple, but the features it have are power-packed!
Map Infographic Creator
Follow samples and map templates to create nfographic maps. It's super-easy!Tools to Create Your Own Infographics
Over the past few centuries, data visualization has evolved so much that we use it every day in all areas of our lives. Many believe that infographic is an effective tool of storytelling, as well as analytics, and that it is able to overcome most of the language and educational barriers. Understanding the mechanisms of human perception will help you to understand how abstract forms and colors used in data visualization can transmit information more efficient than long paragraphs of text.Data Visualization Solutions
Data visualization solutions help you to see how your business can improve. Visualizing sales data using ConceptDraw Sales Dashboard gives you a bird's-eye view of the sale process.Tools for Creating Infographics and Visualizations
ConceptDraw lets you express your professional accomplishments in a simple, but compelling personal infographics and visualizations.Map Infographic Tool
ConceptDraw is a data visualization tool, which can help you to create a map infographics. Anyone can do this, it's that easy!Infographics and Maps
ConceptDraw is a tool that produces colorful infographics.Winter Sports. Illustrations and Visualize Statistics
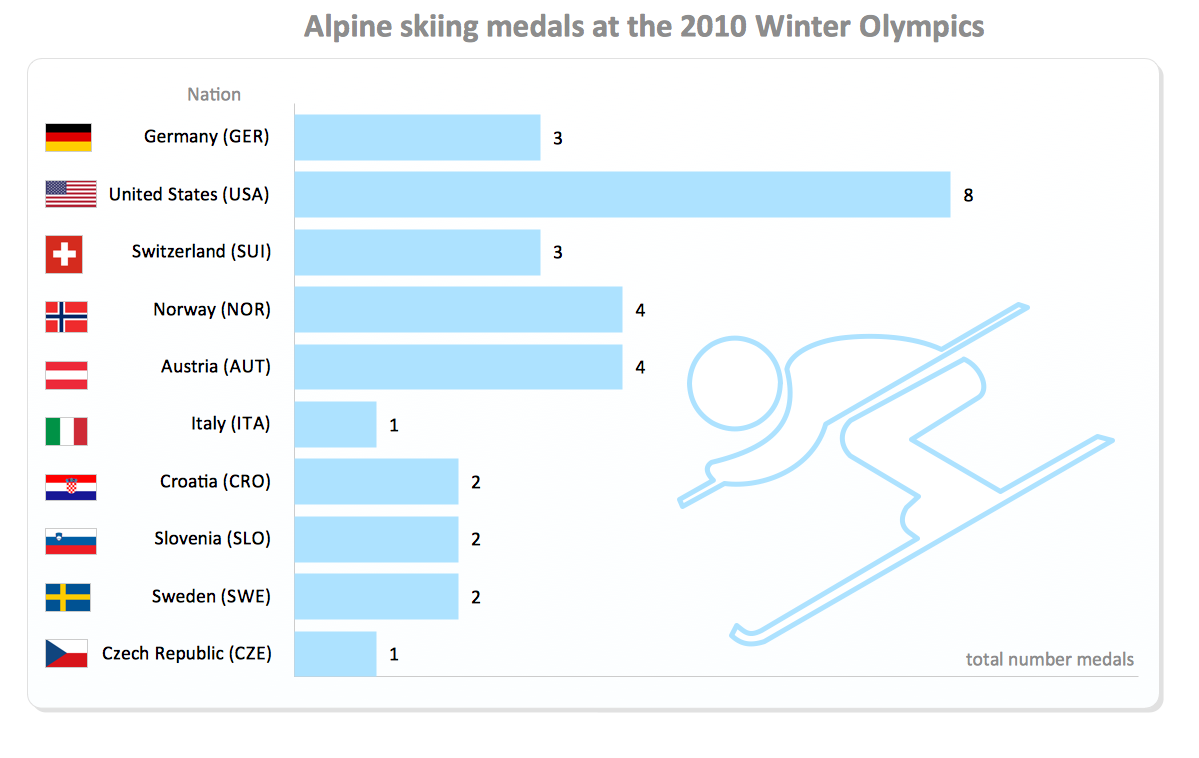
Visualizing sports statistics becomes as easy as never before with ConceptDraw PRO software extended with the Winter Sports solution. This solution delivers a complete set of winter sports illustrations, samples and templates you may use to visualize any kind of sports statistics in minutes.Transportation Infographics
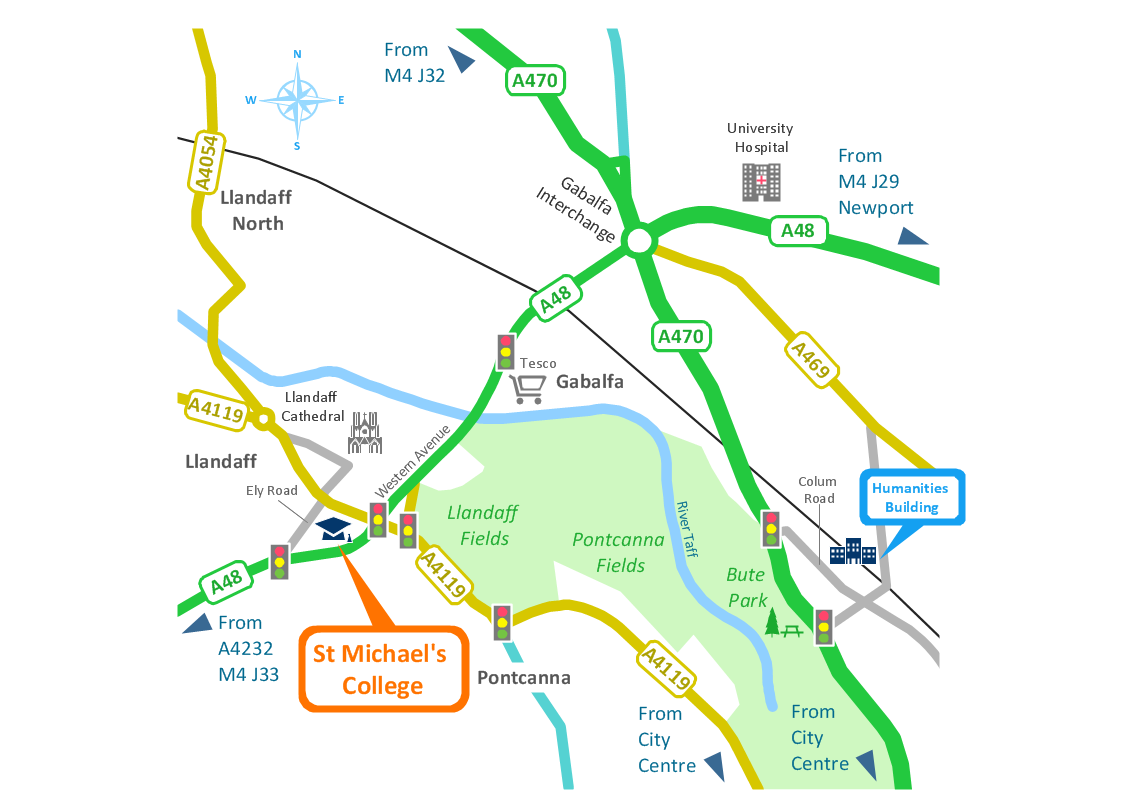
ConceptDraw is a visualization Software for making transportation infographics. Infographics design vector elements and vector graphics which will surely help you in your design process.How tо Represent Information Graphically
ConceptDraw Infographics is a great visual tool for communicating the large amounts of data and graphic visualization and representations of data and information.Map Infographic Design
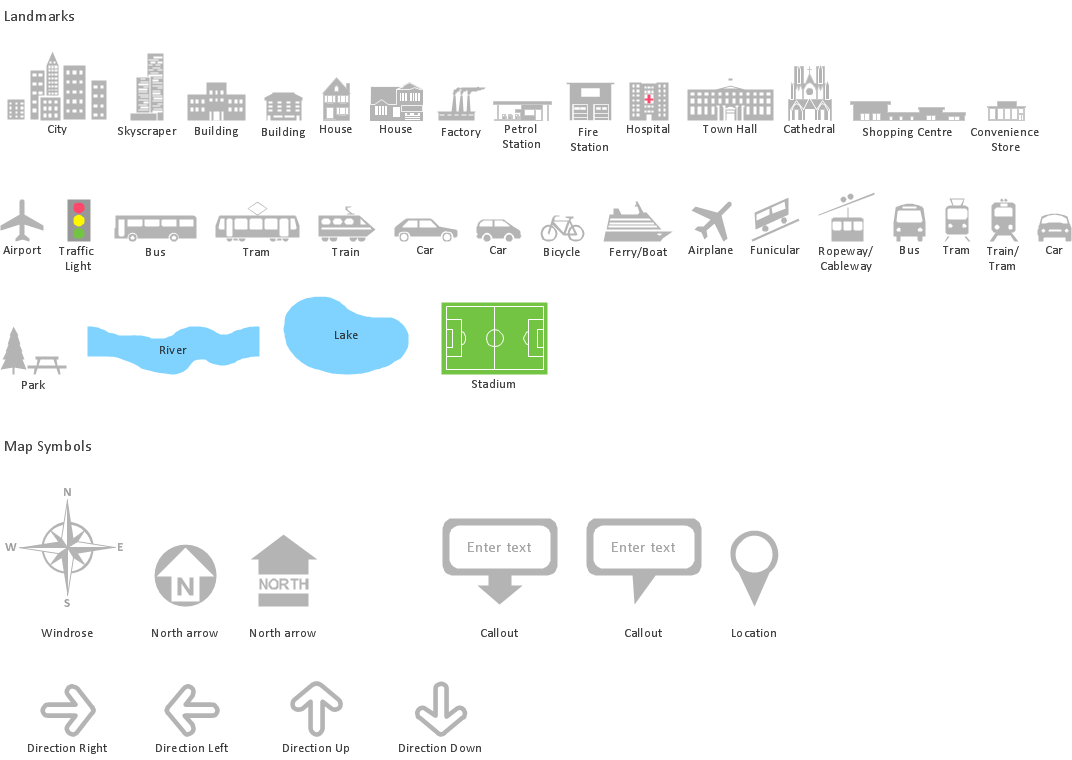
ConceptDraw collection of vector elements for infographics design.Data Visualization Software Solutions
To see how your business can improve you can try data visualization software solutions that allows you visualize all your sales KPI in one sales dashboard allows you monitor and analyse sales activities.Spatial Infographics
Not everyone can make spatial infographics from scratch, ConceptDraw will help you to create your own infographics.Informative and Well-Designed Infographics
Informative and well-designed Infographics allows visually present various map containing information.Quality visualization in your company
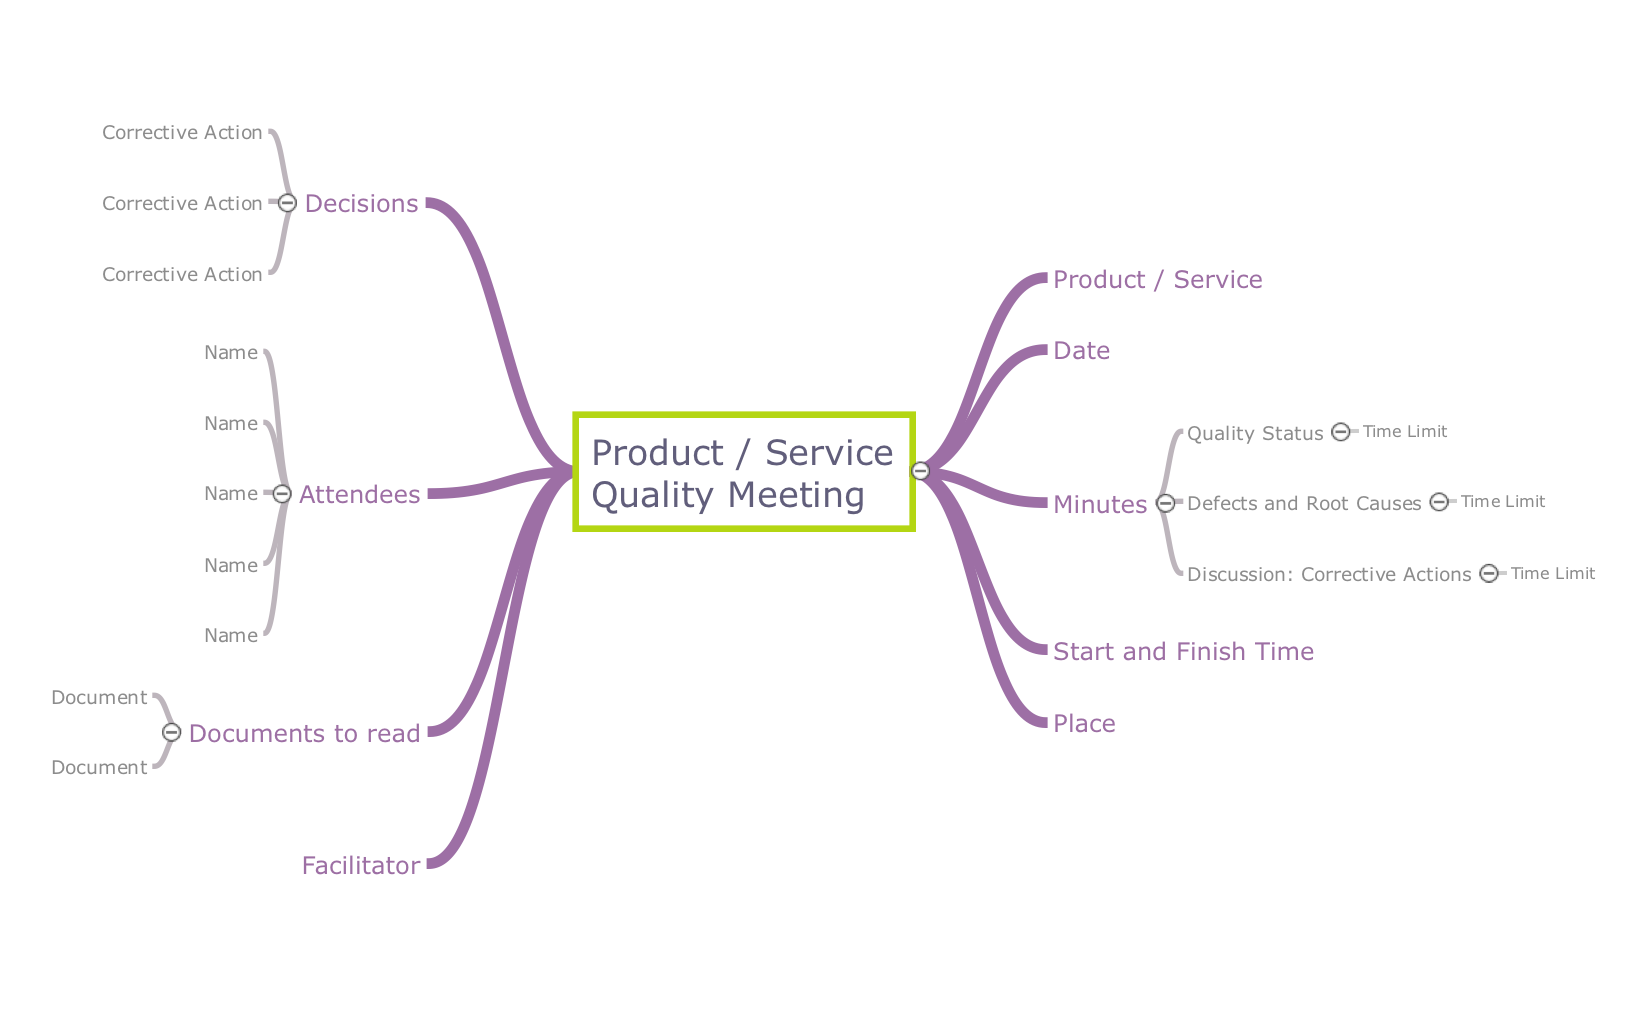
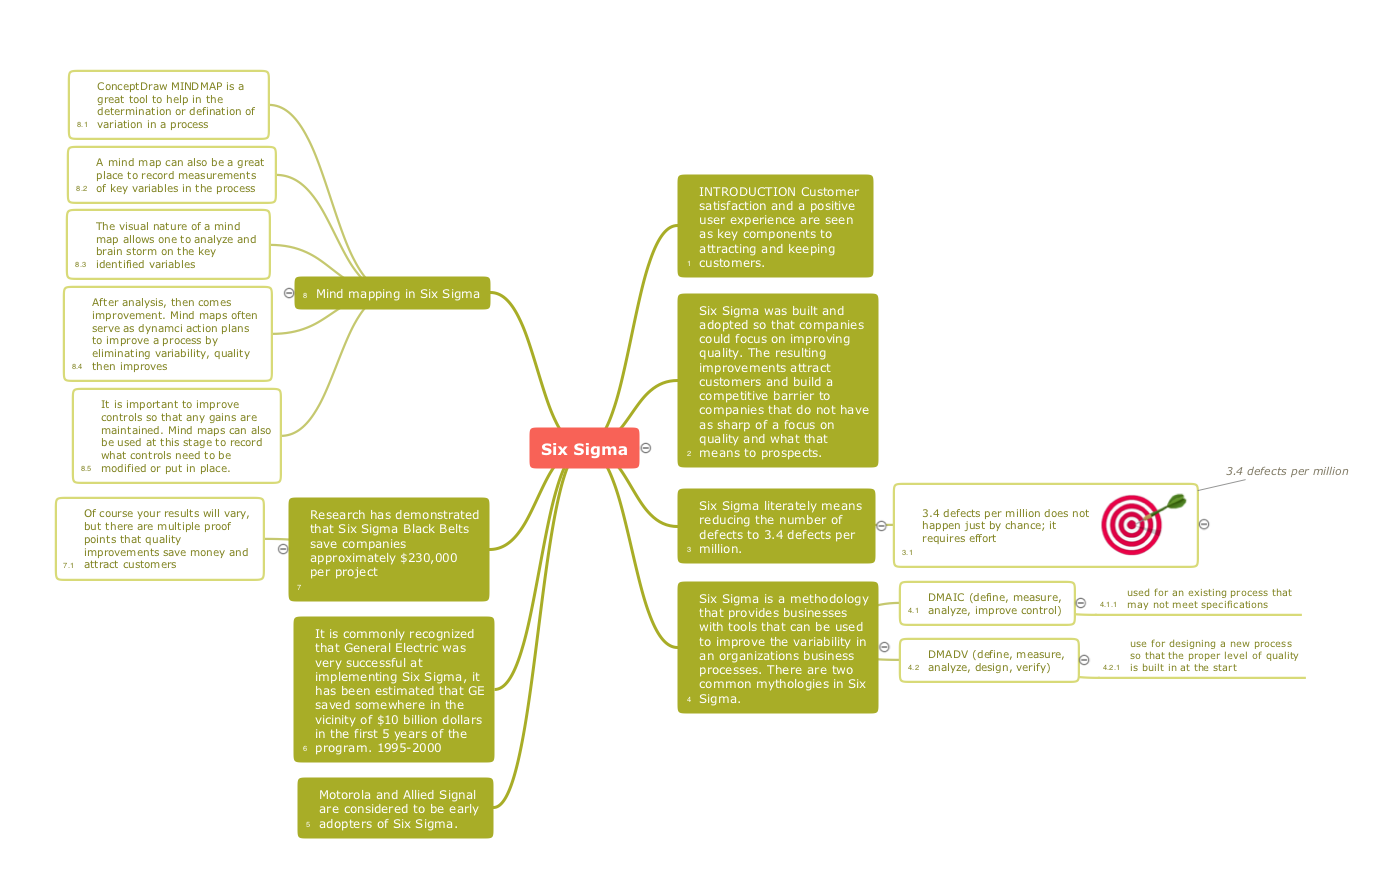
Using ConceptDraw quality mind maps is a perfect addition to quality visualization in your company.Quality Mind Maps - samples and templates
Use samples and templates to describe your own quality processes, brainstorm, and structure quality issues.Chart Maker for Presentations
Easy charting software comes with beautiful chart templates and examples. This makes it easy to create professional charts without prior experience.How to Create a Powerful Infographic When You do not Have a Designer
Create a powerful infographic, become inspired by the people with ConceptDraw.Line Chart Template for Word
This sample was created in ConceptDraw PRO diagramming and vector drawing software using the Line Graphs Solution from Graphs and Charts area of ConceptDraw Solution Park.This sample shows the Line Chart of annual percentage change. The Line Chart allows you to clearly see the changes of data over the time.
- Sales Dashboard | Sales Dashboard Template | Sales Dashboard ...
- Sales Dashboard Template | Sales KPI Dashboards | Visualize ...
- Data Visualization Solutions | Data Visualization Software Solutions ...
- Reporting & Data Visualization | ConceptDraw Solution Park ...
- Cross-Functional Flowcharts | Opportunity flowchart template | Audit ...
- Composition Dashboard | Sales Dashboard Template ...
- Network organization chart | Cisco Network Templates | Network ...
- Value Stream Mapping | Value Stream Mapping Template | Value
- (DFD) template
- Data flow diagram template
- Map Infographic Creator | Visualization Spatial Data Using Thematic ...
- Total Quality Management TQM Diagrams | TQM Diagram Example ...
- Sales Dashboard - Access Anywhere | Sales Dashboard Template ...
- Quality visualization in your company | Quality Improvement | Quality ...
- Sales KPI Dashboards
- Presenting a Slide Show to a Group of People | Visualization of ...
- Network Visualization with ConceptDraw PRO ... - Conceptdraw.com
- Network Drawing Software | Cisco Network Diagrams | Network ...
- Meter Dashboard | Status Dashboard | Visualize Sales Data Using ...
- ConceptDraw Solution Park | Visualization of databases with ...
