Map Infographic Tool
Best Tool for Infographic Construction

Tools to Create Your Own Infographics

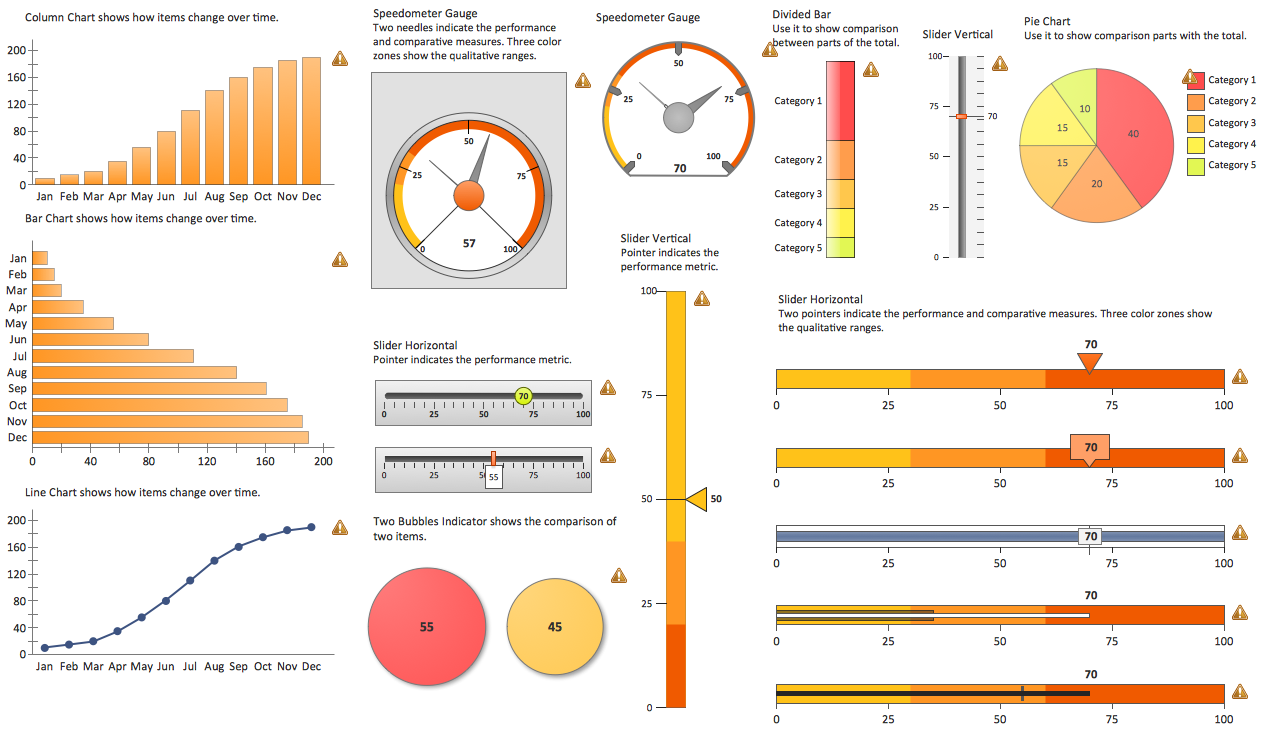
Data Visualization Solutions

Data Visualization Software Solutions

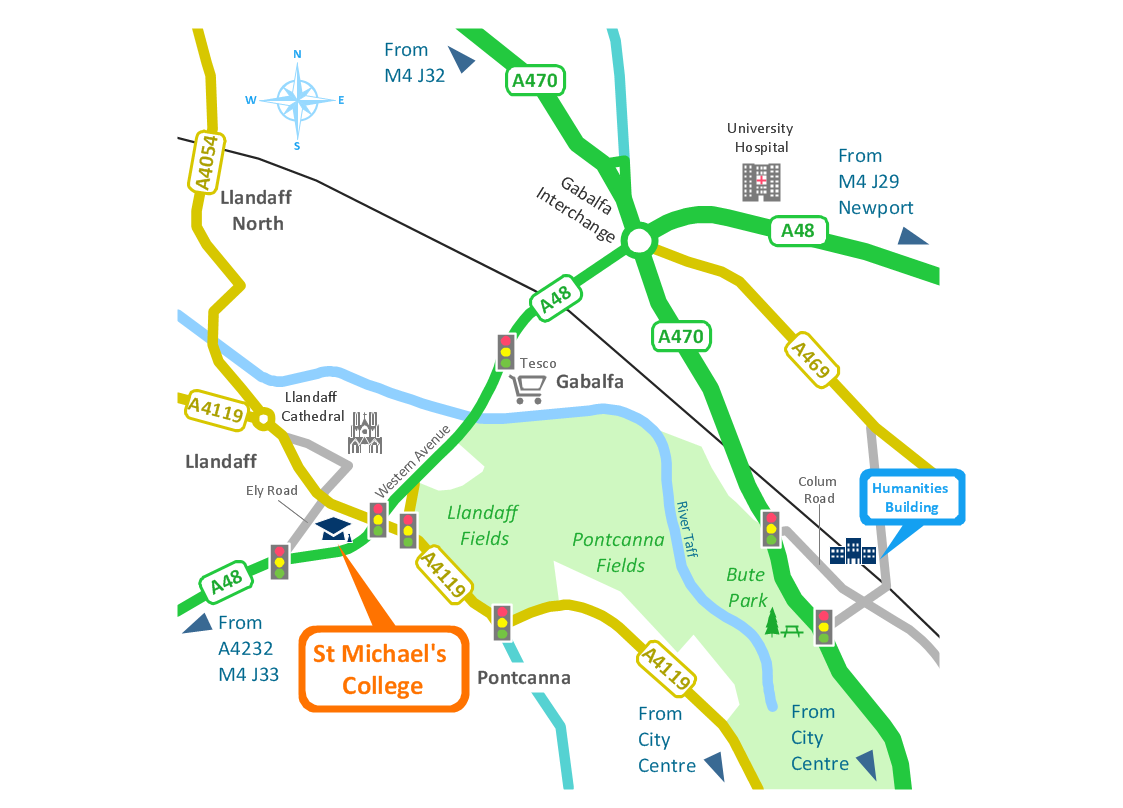
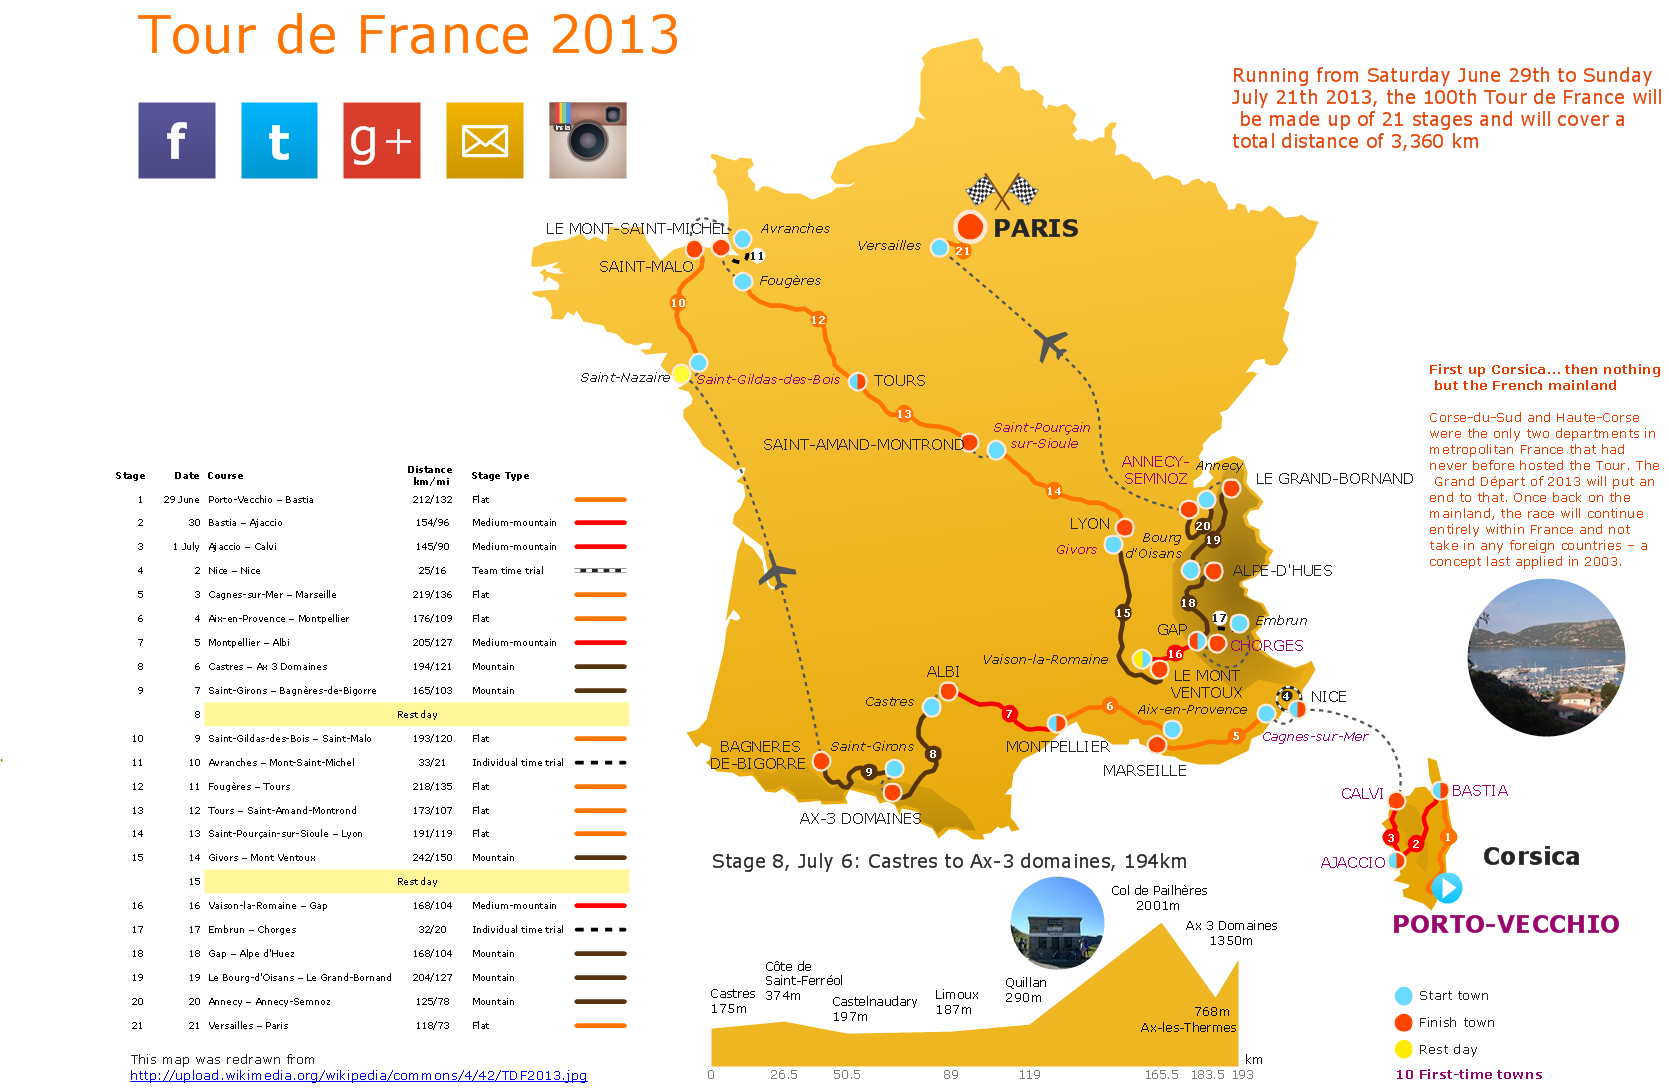
Transportation Infographics
Visualization Spatial Data Using Thematic Maps Combined with Infographics
Travel Infographics

Reporting & Data Visualization
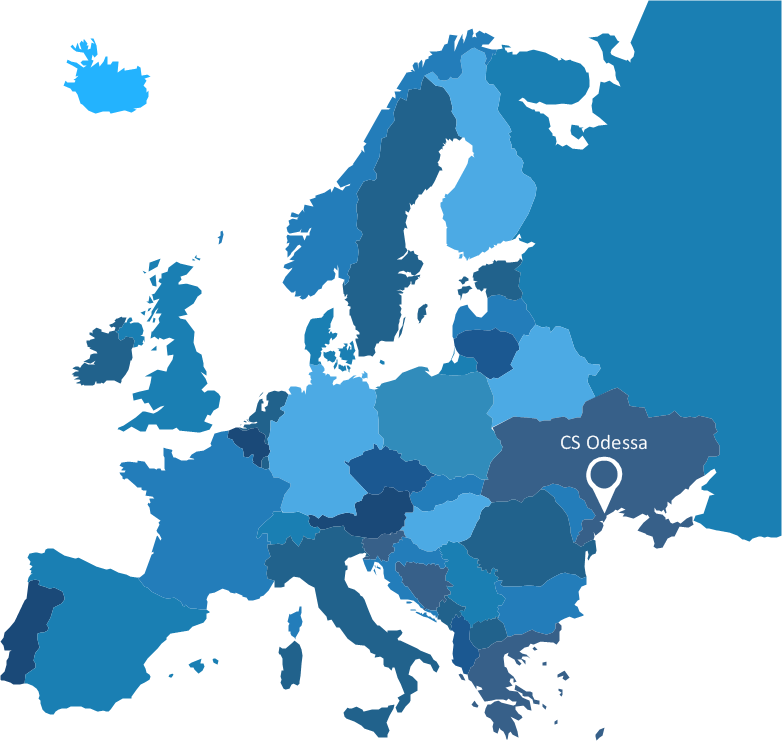
Spatial Infographics

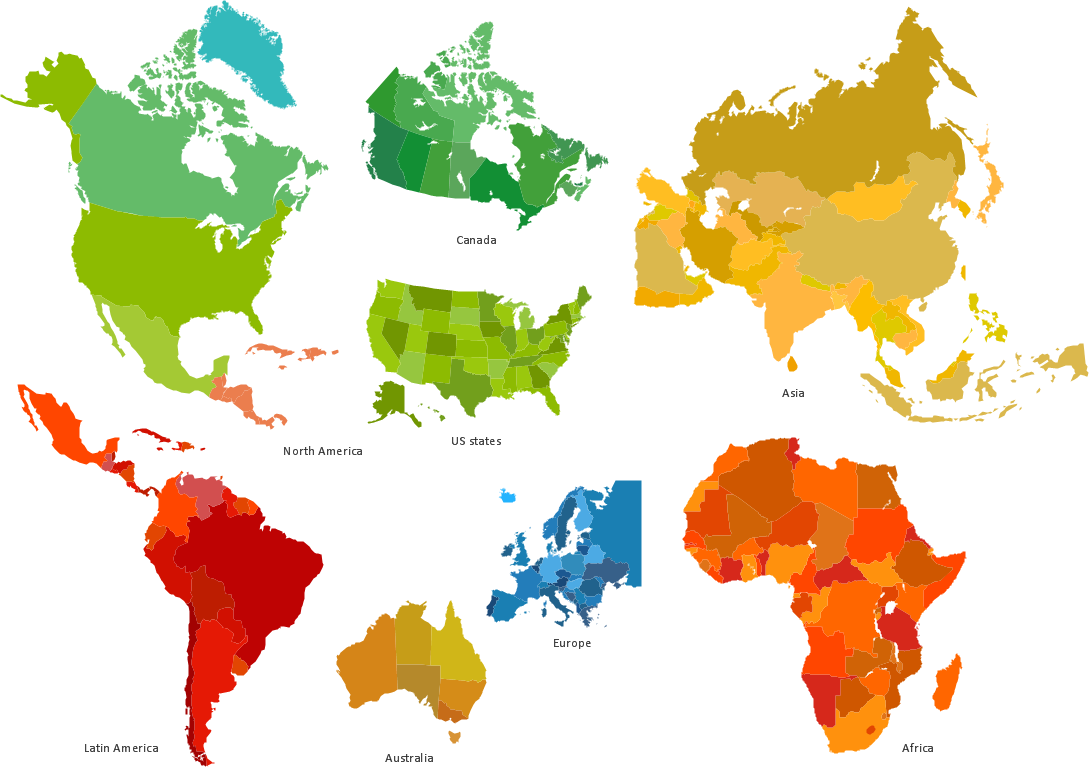
Excellent Examples of Infographic Maps
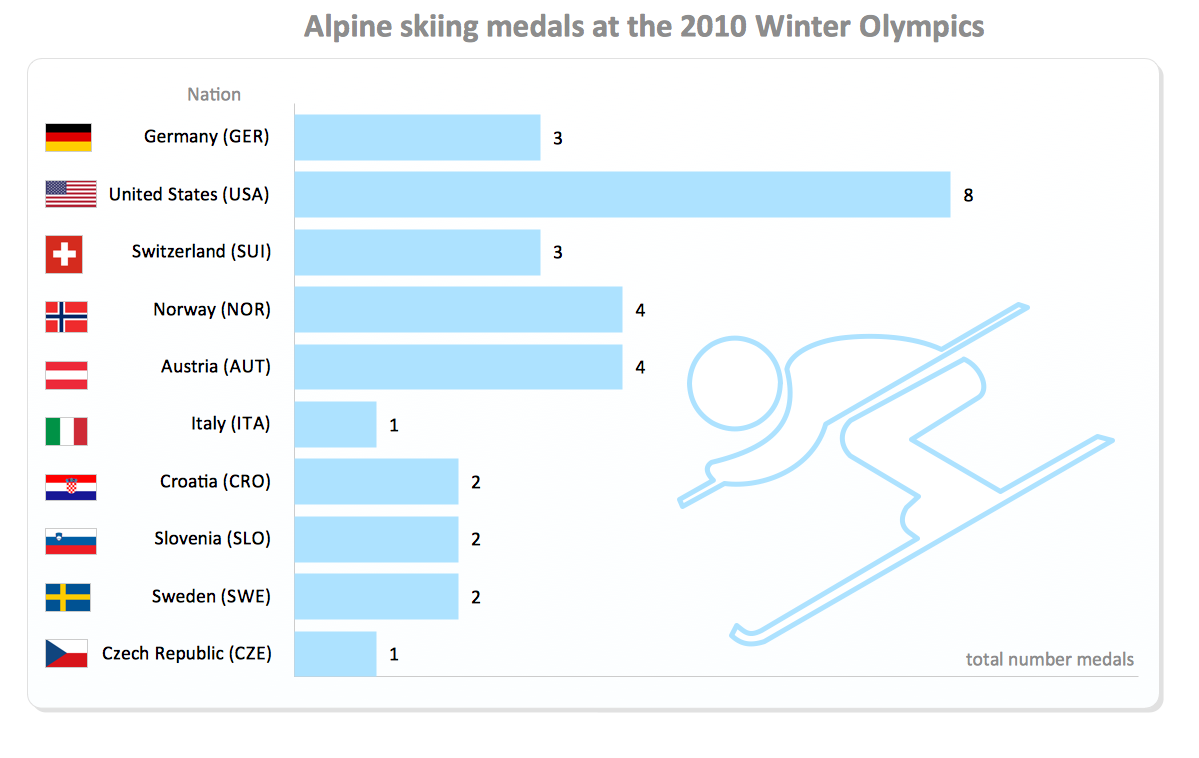
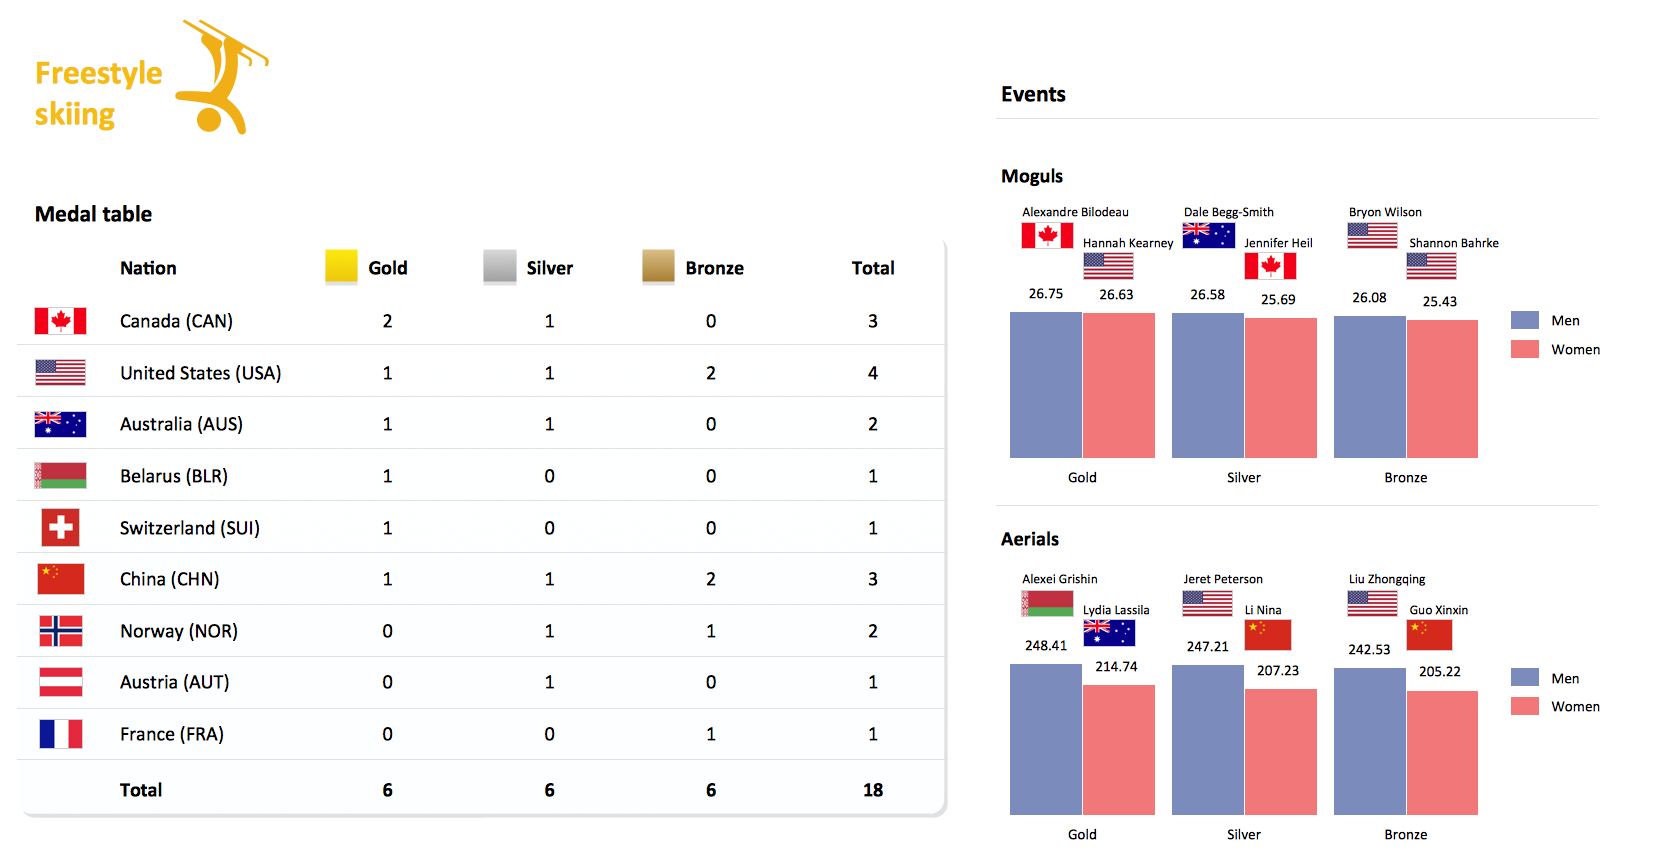
Winter Sports. Illustrations and Visualize Statistics
Map Infographic Design
How tо Represent Information Graphically

Business diagrams & Org Charts with ConceptDraw DIAGRAM


Network Visualization with ConceptDraw DIAGRAM

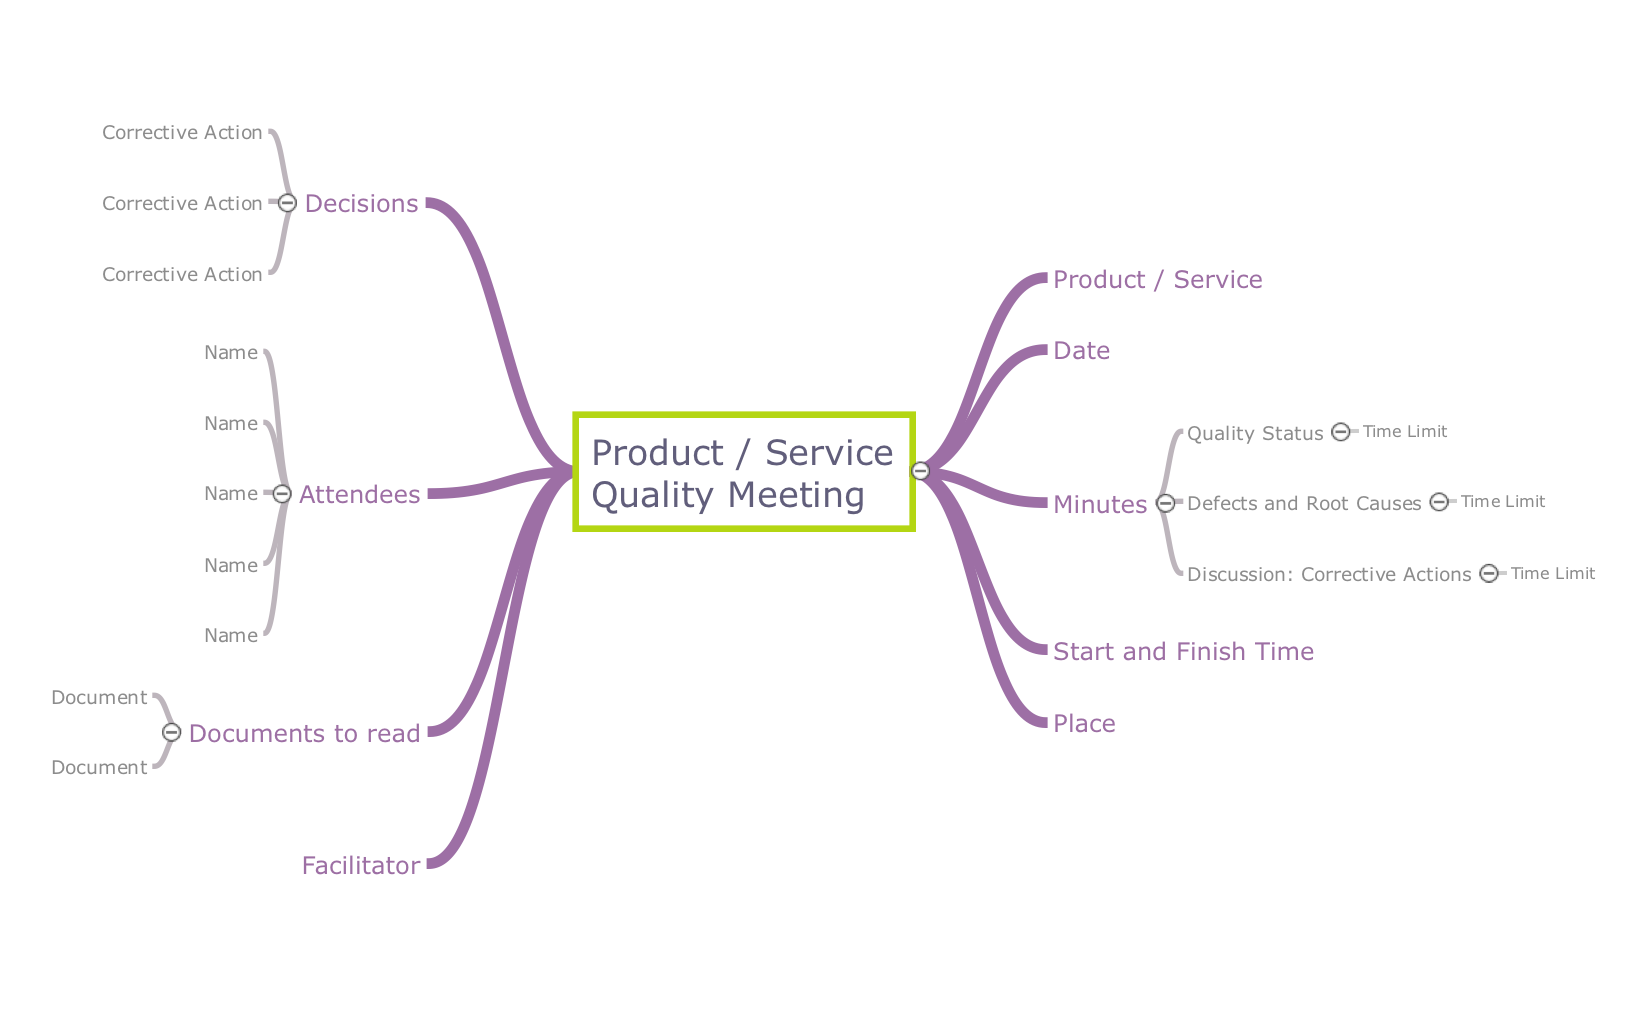
Quality visualization in your company
Winter Sports. Olympic Games Illustrations. Medal Summary
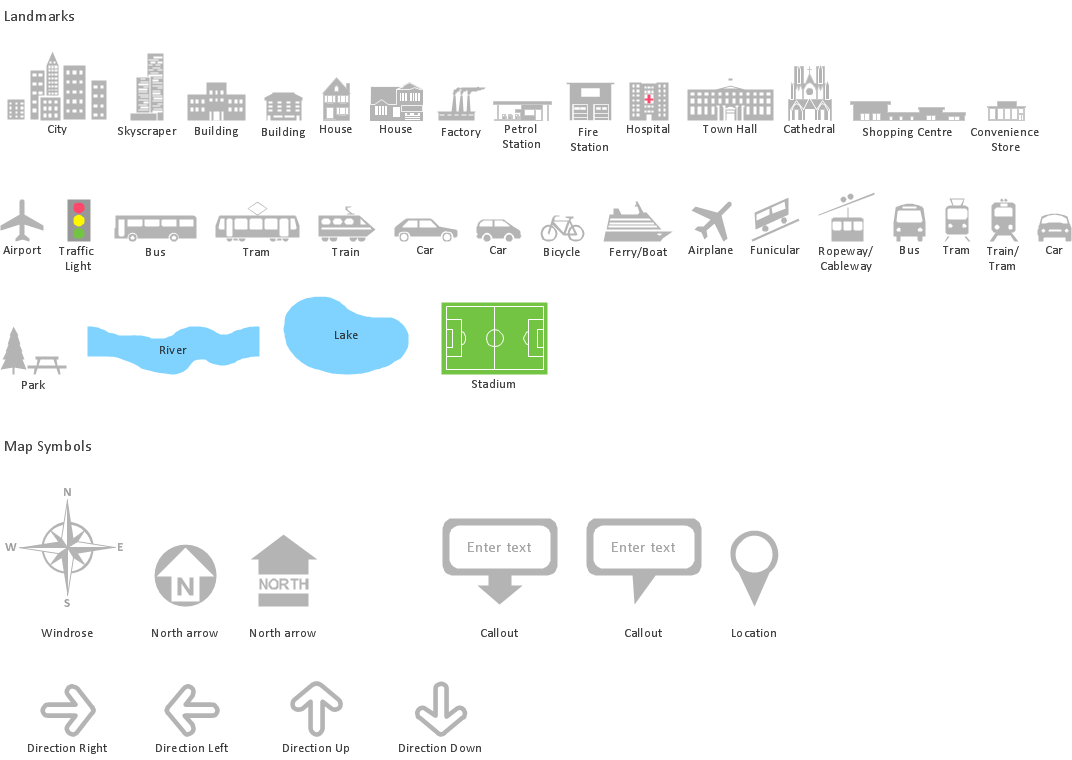
Spatial infographics Design Elements: Location Map
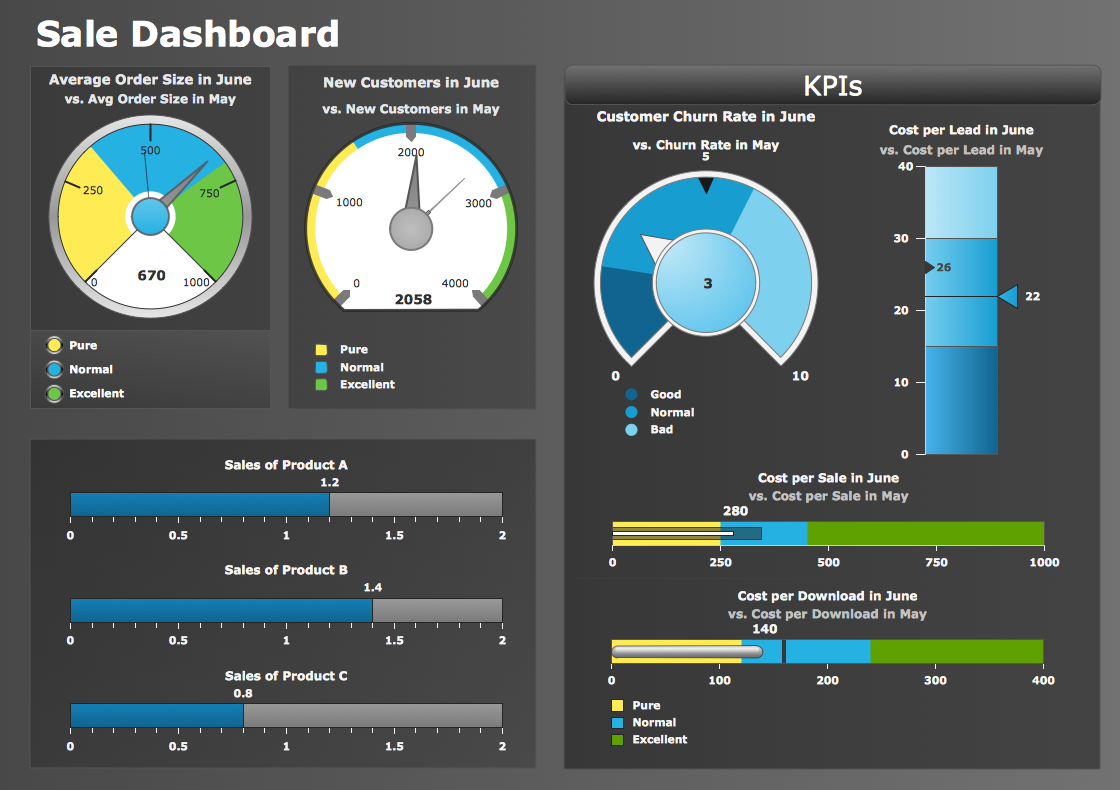
Sales Performance
- Data Visualization Solutions | Map Infographic Tool | Infographics ...
- Map Infographic Design | Spatial Infographics | Map Infographic Tool ...
- Visualization of databases with ConceptDraw PRO | Visualization ...
- Entity-Relationship Diagram (ERD) | ConceptDraw PRO ER ...
- Data Visualization Software Solutions | Data Visualization Solutions ...
- Network Visualization with ConceptDraw PRO | ConceptDraw PRO ...
- What is Infographics Area | Map Infographic Maker | Visualization ...
- Excellent Examples of Infographic Maps | Visualization Spatial Data ...
- Infographics and Maps | Map Infographic Tool | Map Infographic ...
- ConceptDraw PRO ER Diagram Tool | Data Flow Diagrams ...
- ER Diagrams with ConceptDraw PRO
- Map Infographic Creator | Best Tool for Infographic Construction ...
- Infographics and Maps | Visualization Spatial Data Using Thematic ...
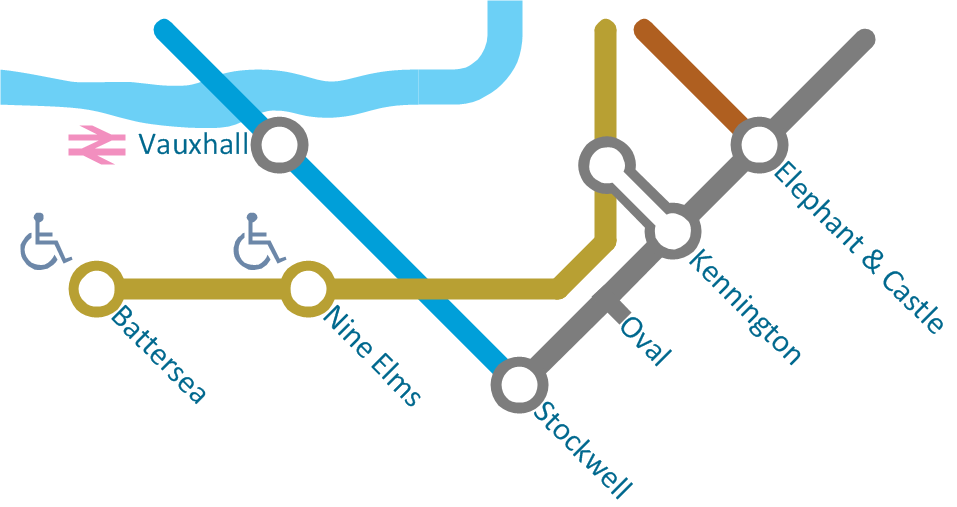
- Spatial infographics Design Elements: Transport Map
- Entity Relationship Diagram Software Engineering | ConceptDraw ...
- Visualization Spatial Data Using Thematic Maps Combined with ...
- Spatial Infographics | What is Infographics Area | Visualization ...
- Map Infographic Creator | Visualization Spatial Data Using Thematic ...
- Spatial Infographics | Spatial Dashboard | Visualization Spatial Data ...
- Maps | Visualization Spatial Data Using Thematic Maps Combined ...