 Composition Dashboard
Composition dashboard solution extends ConceptDraw PRO software with templates, samples and vector stencils library with charts and indicators for drawing visual dashboards showing data composition.
 Frequency Distribution Dashboard
Frequency distribution dashboard solution extends ConceptDraw PRO software with samples, templates and vector stencils libraries with histograms and area charts for drawing the visual dashboards showing frequency distribution of data.
 Comparison Dashboard
Comparison dashboard solution extends ConceptDraw PRO software with samples, templates and vector stencils library with charts and indicators for drawing the visual dashboard comparing data.
The vector stencils library "Picture Graphs" contains 4 image chart templates. Use it to design your pictorial bar charts in ConceptDraw PRO diagramming and vector drawing software.
"Pictorial bar graph.
Sometimes reffered to as a pictographs. A pictorial bar graph is a graph in which the rectangular bars have been filled with pictures, sketches, icons, etc. or where pictures, sketches, icons, etc. have been substituted for the rectangular bars. In both variations, one or more symbols might be used in each bar. The two major reasons for using pictorial graphs are to make the graph more appealing visually and to facilitate better communications." [Information Graphics: A Comprehensive Illustrated Reference. R. L. Harris. 1999. p.41]
The chart templates example "Design elements - Picture graphs" is included in the Basic Picture Graphs solution from the Graphs and Charts area of ConceptDraw Solution Park.
 Time Series Dashboard
Time series dashboard solution extends ConceptDraw PRO software with templates, samples and vector stencils libraries with charts, graphs and plots for drawing the visual dashboards showing data time series.
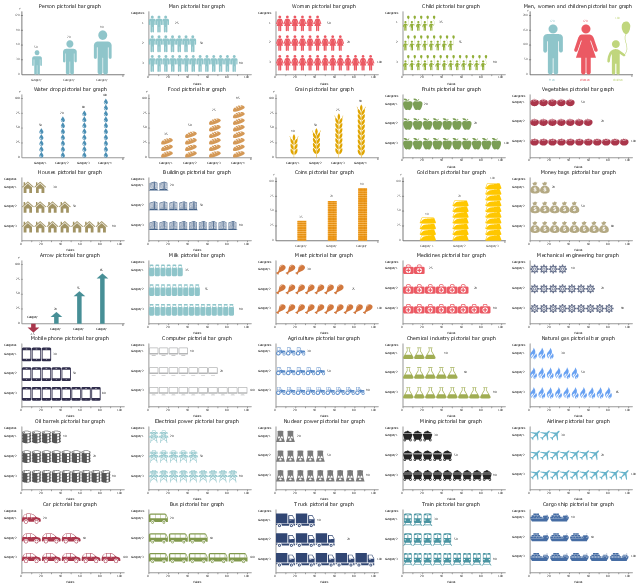
The vector stencils library "Picture bar graphs" contains 35 templates of pictorial charts. Use it for visualization of data comparison and time series with ConceptDraw PRO diagramming and vector drawing software.
"Pictorial bar graph.
Sometimes reffered to as a pictographs. A pictorial bar graph is a graph in which the rectangular bars have been filled with pictures, sketches, icons, etc. or where pictures, sketches, icons, etc. have been substituted for the rectangular bars. In both variations, one or more symbols might be used in each bar. The two major reasons for using pictorial graphs are to make the graph more appealing visually and to facilitate better communications." [Information Graphics: A Comprehensive Illustrated Reference. R. L. Harris. 1999. p.41]
The pictorial charts example "Design elements - Picture bar graphs" is included in the Picture Graphs solution from the Graphs and Charts area of ConceptDraw Solution Park.
- 4 P Diagram
- IDEF0 standard with ConceptDraw PRO | Workflow Flowchart ...
- Interactive Venn Diagram | Venn Diagrams | How to Create a Venn ...
- Process P
- Swim Lane Flowchart Symbols | Cross-Functional Flowchart (Swim ...
- Free P
- Proses Flow Digram Convert To P
- Picture Graph Or Pictograph
- Floor Plans | Emergency Plan | Word Exchange | Floor P
- Symbol In P
- Marketing mix diagram | Business Productivity - Marketing | Target ...
- Marketing P
- Venn Diagram Template for Word | Venn Diagrams | Venn Diagram ...
- Design elements - Picture bar graphs
- Open Office P
- Bar Chart Software | Design elements - Picture bar graphs | Design ...
- Design elements - Picture graphs | How to Draw Pictorial Chart. How ...
- Entity Relationship Diagram - ERD - Software for Design Crows Foot ...
- Design elements - Picture bar graphs | Design elements - Time ...
- Sales Process Flowchart. Flowchart Examples | Sales Process ...

