The vector stencils library "Windows 8 round icons" contains 42 Windows 8 user interface (UI) round icons.
Use it to design the graphic user interface (GUI) of your software application for Windows 8 operating system (OS).
The example "Design elements - Windows 8 round icons" was created using the ConceptDraw PRO diagramming and vector drawing software extended with the Windows 8 User Interface solution from the Software Development area of ConceptDraw Solution Park.
The vector stencils library "AWS Storage" contains 18 Amazon Web Services storage icons: Amazon EFS icons, Amazon Glacier icons, Amazon S3 icons, AWS Snowball icons, AWS Storage Gateway icons, Amazon EBS icon, snapshot icon, volume icon.
Use it to draw Amazon Web Services architecture diagrams with ConceptDraw PRO diagramming and vector drawing software.
"AWS provides a variety of services to meet your storage needs. ...
The following are the key storage services:
Amazon S3
Scalable storage in the AWS cloud.
CloudFront
A global content delivery network (CDN).
Amazon EBS
Network attached storage volumes for your virtual servers.
Amazon Glacier
Low-cost archival storage." [docs.aws.amazon.com/ gettingstarted/ latest/ awsgsg-intro/ gsg-aws-storage-cdn.html]
The AWS icons example "Design elements - AWS Storage and Content Delivery" is included in the AWS Architecture Diagrams solution from the Computer and Networks area of ConceptDraw Solution Park.
Competitor Analysis
Competitor analysis is a first and obligatory step in elaboration the proper corporate marketing strategy and creating sustainable competitive advantage. Use powerful opportunities of numerous solutions from ConceptDraw Solution Park for designing illustrative diagrams, charts, matrices which are necessary for effective competitor analysis.Social Media Flowchart Symbols
Social media is a popular view of mass communication which allows people, companies and organizations create, share, discover, modify, access, comment, discuss and exchange information through the Internet. Social Media Response solution for ConceptDraw PRO provides collection of 10 libraries with diversity of predesigned vector social media flowchart symbols for fast and easy creating interactive Social Media Flowcharts, Response Charts and Action Mind Maps.Pie Chart Software
A pie chart is a circular diagram showing a set of data divided into proportional slices. There are several variations of this chart such as donut chart, exploded pie chart, multi-level pie charts. Although it is not very informative when a ring chart or circle chart has many sections, so choosing a low number of data points is quite important for a useful pie chart. ConceptDraw PRO software with Pie Charts solution helps to create pie and donut charts for effective displaying proportions in statistics, business and mass media for composition comparison, i.e. for visualization of part percentage inside one total.Export from ConceptDraw MINDMAP to PowerPoint® Presentation
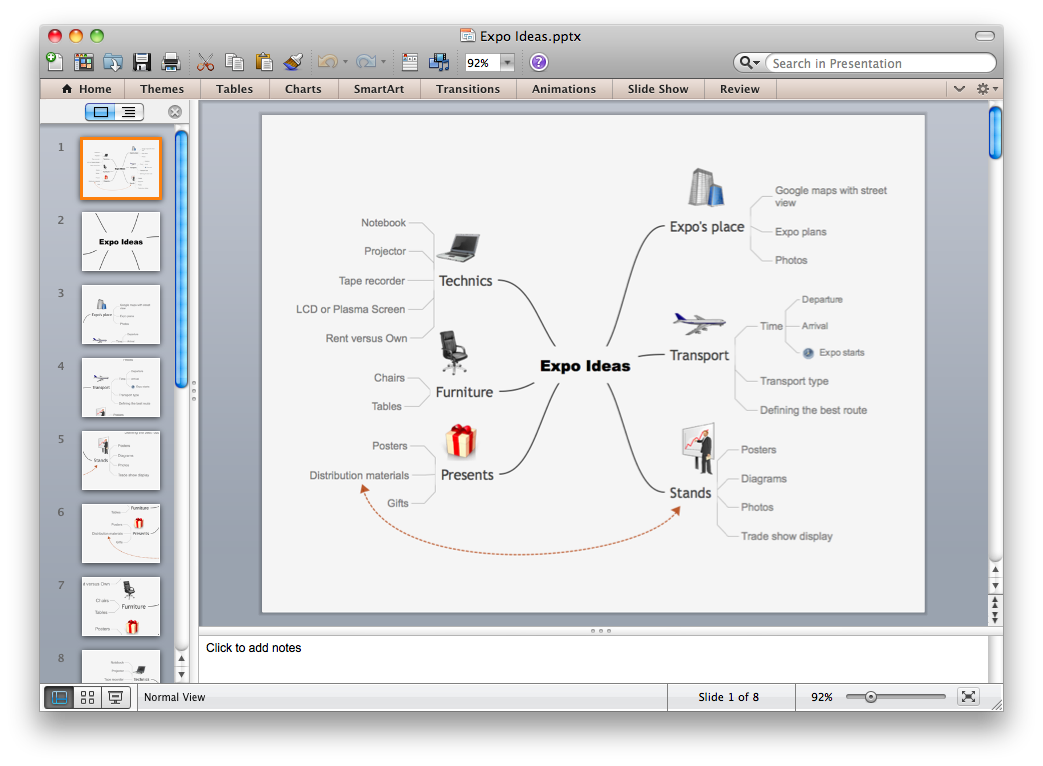
ConceptDraw MINDMAP extended with Presentation Exchange solution allows you to create a traditional PowerPoint Presentation from your mind maps.
to MS PowerPoint
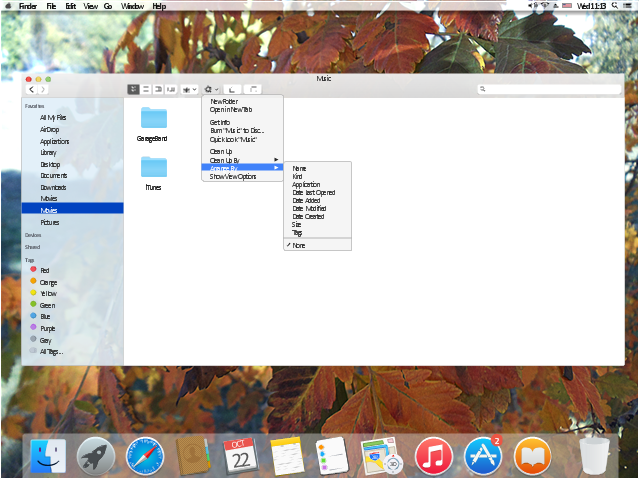
The example "OS X 10.10 Yosemite - Finder window" shows usage of user interface (UI) design elements: window frame, toolbar, menu, app icons, wallpapers.
"The Finder is the default file manager and graphical user interface shell used on all Macintosh operating systems. Described in its "About" window as "The Macintosh Desktop Experience", it is responsible for the launching of other applications, and for the overall user management of files, disks, and network volumes. It was introduced with the first Macintosh computer, and also exists as part of GS/ OS on the Apple IIGS. It was totally rewritten with the release of Mac OS X in 2001. In a tradition dating back to the classic Mac OS of the 1980s and 1990s, the Finder icon is the smiling screen of a computer, known as the Happy Mac logo." [Finder (software). Wikipedia]
The GUI example "OS X 10.10 Yosemite - Finder window" was created using the ConceptDraw PRO diagramming and vector drawing software extended with the Mac OS User Interface solution from the Software Development area of ConceptDraw Solution Park.
Cloud Computing
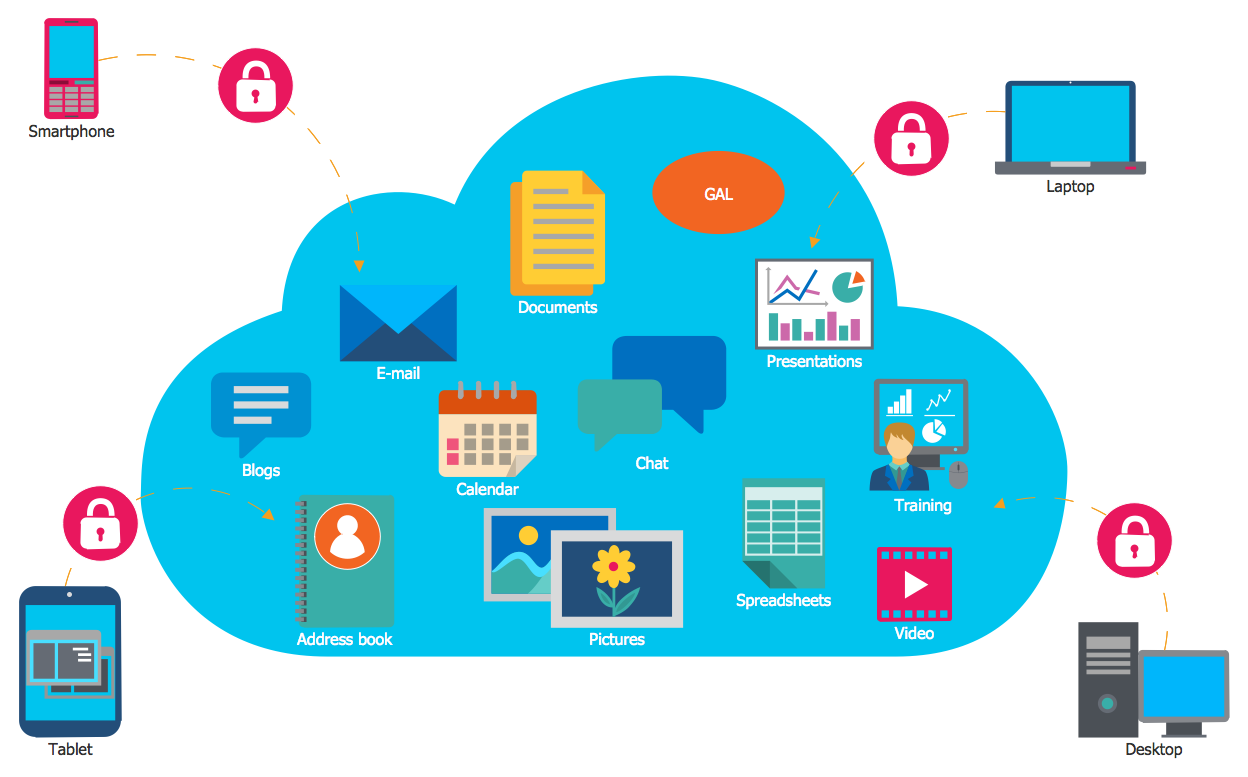
The Cloud Computing is the use of the software and hardware that includes the great number of computers connected over the communication network such as the Internet. The Cloud name comes from the usage the cloud symbol on the system diagrams as the abstraction for the complex network infrastructure. This term is used as a marketing metaphor for the Internet. This example was created in ConceptDraw PRO using the Computer and Networks Area of ConceptDraw Solution Park and shows the Cloud Computing.Electrical Symbols — Resistors
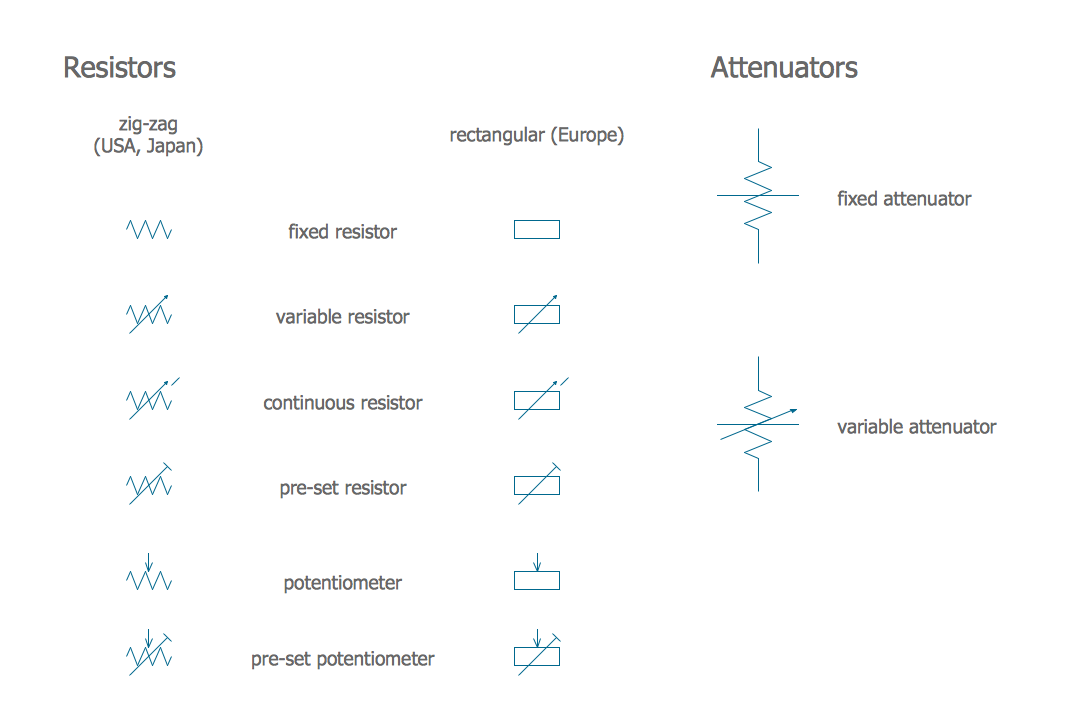
A resistor is a passive two-terminal electrical component that implements electrical resistance as a circuit element. Resistors may be used to reduce current flow, and, at the same time, may act to lower voltage levels within circuits. In electronic circuits, resistors are used to limit current flow, to adjust signal levels, bias active elements, and terminate transmission lines among other uses. Fixed resistors have resistances that only change slightly with temperature, time or operating voltage. Variable resistors can be used to adjust circuit elements (such as a volume control or a lamp dimmer), or as sensing devices for heat, light, humidity, force, or chemical activity. 26 libraries of the Electrical Engineering Solution of ConceptDraw PRO make your electrical diagramming simple, efficient, and effective. You can simply and quickly drop the ready-to-use objects from libraries into your document to create the electrical diagram.Flow chart Example. Warehouse Flowchart
Warehouse Flowcharts are various diagrams that describe the warehousing and inventory management processes on the warehouses. Typical purposes of Warehouse Flowcharts are evaluating warehouse performance, measuring efficiency of customer service and organizational performance. This type of Workflow diagrams can be used for identifying any disconnection between business activities and business objectives. They are effectively used by warehouse-related people and organizations, manufacturers, wholesalers, exporters, importers, transporters, and others. Standard Warehousing process flow diagram and standard Workflow diagram are used for process identification for further evaluating effectiveness and profitability of overall business process. Use the ConceptDraw PRO vector graphic software extended with Flowcharts solution to design your own professional-looking Workflow diagrams and Flowcharts of any types, including the Warehouse flowchart, Process flow diagrams which depict in details all steps of Warehouse packages flow. Microsoft Visio, designed for Windows users, can’t be opened directly on Mac. But fortunately, there are several Visio alternatives for Mac which will help Mac users to work Visio files. With ConceptDraw PRO, you may open, edit and save files in Visio format.
Internet solutions with ConceptDraw PRO
ConceptDraw is a good means of visualization of information of any kind as it features powerful graphic capabilities. The conception of using ConceptDraw and open formats by the programs that work with Internet can be used for displaying any data and any structure in Internet.Critical Path Method in ConceptDraw PROJECT
The Critical Path Method (CPM) is an algorithm for scheduling a set of project activities. It is an important tool for effective project management. ConceptDraw PROJECT implements this method to provide the user with a wide set of project management tools.How to Discover Critical Path on a Gantt Chart
ConceptDraw PROJECT is the Gantt chart software that implements critical path method to provide the user with a wide set of project management tools.Gant Chart in Project Management
Gantt Chart is a graphical representation of tasks as segments on a time scale. It helps plan and monitor project development or resource allocation. There are list of tasks, project milesones and stages. The horizontal axis is a time scale, expressed either in absolute or relative time. Gantt chart can be used for planning in virtually any industry. There are major project planning tools using gantt chart for creating project plan. For instance, using ConceptDraw PROJECT together with ConceptDraw MINDMAP for planning marketing actions is very effective way. It makes ConceptDraw Office best marketing project management software for gantt chart planning marketing message, scheduling stages when to send massive text messages or when use email marketing services in specific projects. There are simple steps on how to use project management software for marketing, sales actions and product support. This is simple all in one toolbox for managers who need best project management software for small business as for planning and brainstorming as for reporting at project execution stage. Using gantt charts together with mindmap visuals and professional presentations charts make it excellent creative project management software. ConceptDraw PROJECT is portfolio project management software it allows manage many projects with multi gantt chart.
- Design elements - Windows 8 round icons | Play Pause Volume ...
- Design elements - Android system icons (communication) | Design ...
- Media Icon
- Cisco WAN. Cisco icons , shapes, stencils and symbols | iPhone ...
- IVR phones - Vector stencils library | IVR mobile - Vector stencils ...
- AWS simple icons v2.0 - Vector stencils library | AWS simple icons ...
- Volume Control
- Percentage Pie Chart. Pie Chart Examples | Atmosphere air ...
- Cisco Multimedia, Voice, Phone. Cisco icons , shapes, stencils and ...
- Flowchart design. Flowchart symbols, shapes, stencils and icons ...
- Mic Icon Png
- Cisco Routers. Cisco icons , shapes, stencils and symbols | Basic ...
- Design elements - Windows 8 round icons | GUI Software | Design ...
- What is SWOT Analysis? | Growth- Share Matrix Software | SWOT ...
- Design elements - IVR blocks | IVR systems architecture | Call ...
- Export from ConceptDraw PRO Document to a Graphic File | How to ...
- Top 5 Android Flow Chart Apps | Android UI Design Tool ...
- Cisco Security. Cisco icons , shapes, stencils and symbols ...
- Icon App Windows 8
- AWS Simple Icons for Architecture Diagrams | Cisco Network ...


