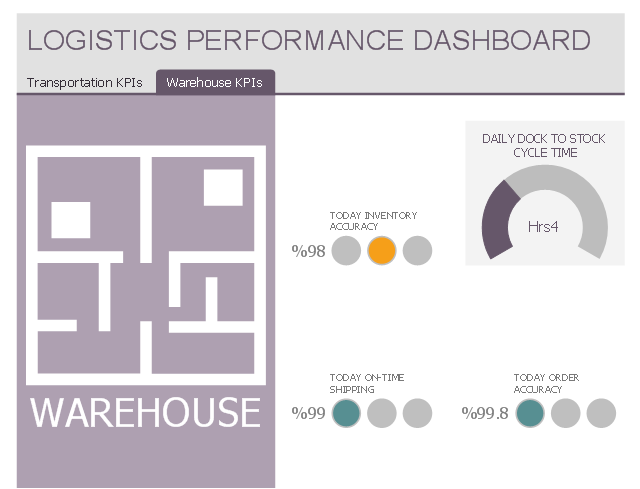
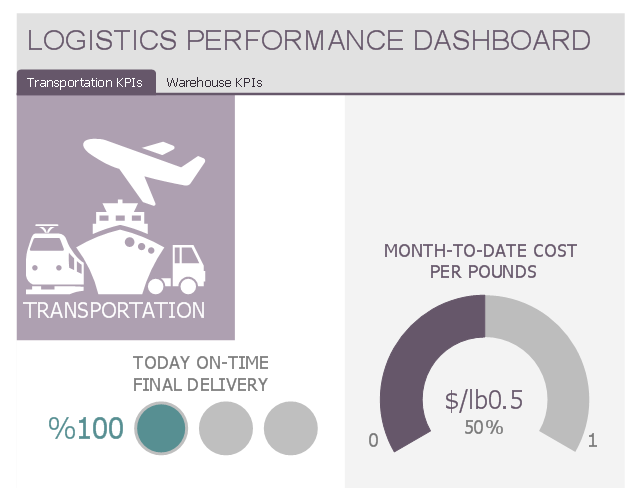
This multipage performance dashboard example shows navigation tab set and graphic indicators of logistic key performance indicators (KPIs) and business metrics.
"Dashboards often provide at-a-glance views of KPIs (key performance indicators) relevant to a particular objective or business process (e.g. sales, marketing, human resources, or production)." [Dashboard (business). Wikipedia]
The business dashboard example "Logistics Performance Dashboard" was designed using ConceptDraw PRO software extended with Logistic Dashboard solution from Business Processes area of ConceptDraw Solution Park.
Transportation KPIs
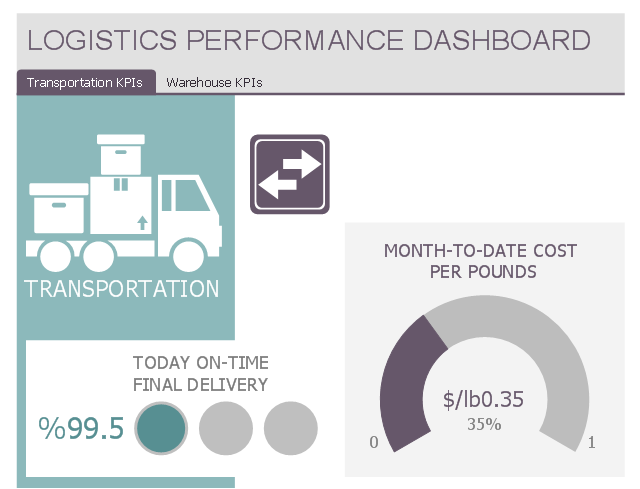
Warehouse KPIs
This multipage performance dashboard template contains navigation tab set and graphic indicators of logistic key performance indicators (KPIs) and business metrics.
Use it to create your logistic performance dashboard with ConceptDraw PRO software.
The business dashboard template "Logistics Performance Dashboard" is included in Logistic Dashboard solution from Business Processes area of ConceptDraw Solution Park.
Use it to create your logistic performance dashboard with ConceptDraw PRO software.
The business dashboard template "Logistics Performance Dashboard" is included in Logistic Dashboard solution from Business Processes area of ConceptDraw Solution Park.
Transportation KPIs
Warehouse KPIs

 Logistic Dashboard
The powerful tools of Logistic Dashboard solution and specially developed live graphic objects of logistic icons, logistic navigation elements, logistic indicators, logistic charts and logistic maps effectively assist in designing Logistic dashboards, Logistic maps, Logistic charts, diagrams and infographics. The included set of prebuilt samples and quick-start templates, demonstrates the power of ConceptDraw DIAGRAM software in logistics management, its assisting abilities in development, realization and analyzing the logistic processes, as well as in perfection the methods of logistics management.
Sales Dashboard Solutions can help your sales team keep an eye on performance

HelpDesk
How to Make a Logistic Dashboard

Approval Process and Segregation of Responsibilities Accounting Flowchart Example

Cross Functional Flowchart Examples

Try now Flowchart Software and Cross-Functional library with 2 libraries and 45 vector shapes of the Cross-Functional Flowcharts solution. Then you can use built-in templates to create and present your software service cross-function process flowcharts.
Improving Problem Solving and Focus with Fishbone Diagrams

ConceptDraw DIAGRAM extended with Fishbone Diagrams solution gives a powerful tool for improving problem solving and focus with Fishbone diagrams.
Export from ConceptDraw DIAGRAM Document to a Graphic File

ConceptDraw DIAGRAM can save your drawings and diagrams in a number of highly useful formats, including graphic files. You can save your drawing as a.PNG,.JPG, or other graphic format file.

- Logistics Performance Dashboard - Template | Sales KPIs ...
- Logistics Performance Dashboard
- Logistics Performance Dashboard - Template
- KPI Dashboard | Performance Indicators | Sales Dashboard | Key ...
- Performance Indicators | KPI Dashboard | Constant improvement of ...
- KPI Dashboard | Business Graphics Software | Logistics ...
- Logistics KPI Dashboard - Template | Sales Dashboard Template ...
- Design elements - Logistic warehouse | Flow chart Example ...
- HR Dashboard | KPI Dashboard | HR Performance Dashboard ...
- Sales Dashboard Template | Logistic Dashboard | Logistics and ...
- ERD | Entity Relationship Diagrams, ERD Software for Mac and Win
- Flowchart | Basic Flowchart Symbols and Meaning
- Flowchart | Flowchart Design - Symbols, Shapes, Stencils and Icons
- Flowchart | Flow Chart Symbols
- Electrical | Electrical Drawing - Wiring and Circuits Schematics
- Flowchart | Common Flowchart Symbols
- Flowchart | Common Flowchart Symbols