Process Flow Chart
A Process Flow Chart is a type of flowchart which is mostly used in industrial, chemical and process engineering for illustrating high-level processes, major plant processes and not shows minor details. ConceptDraw DIAGRAM diagramming and vector drawing software extended with Flowcharts Solution from the "Diagrams" Area of ConceptDraw Solution Park is the best way to create Process Flow Chart and other types of flowcharts.Cross-Functional Flowchart
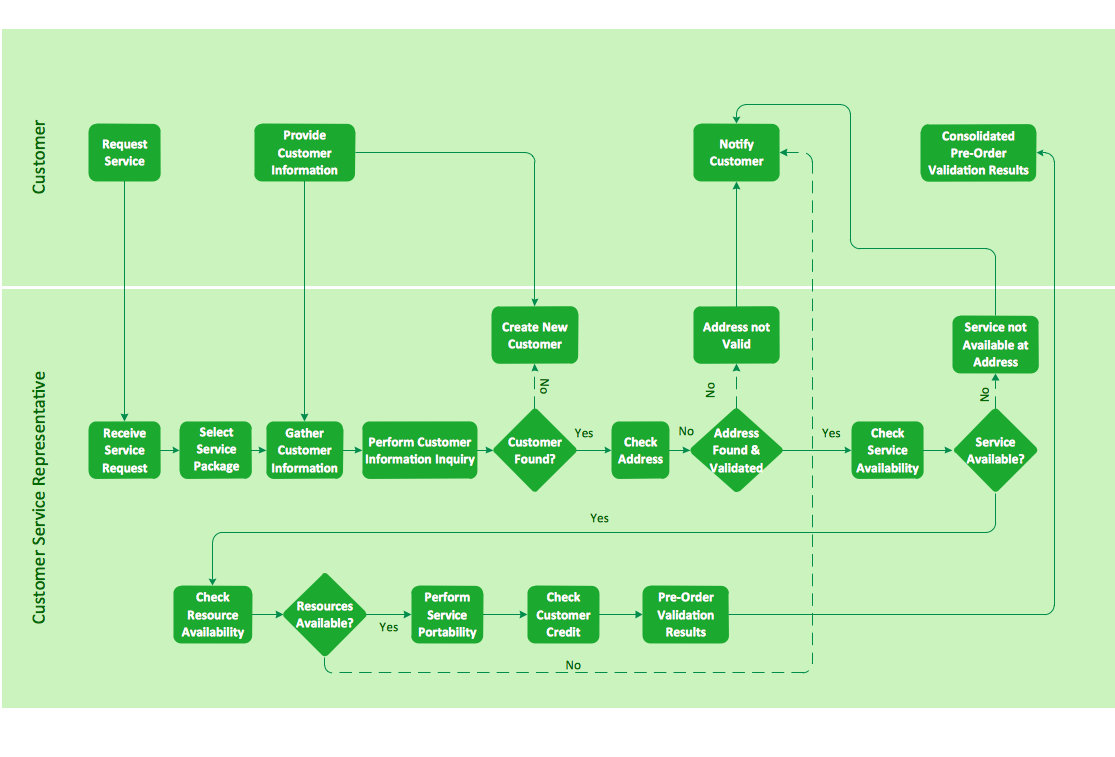
Use of Cross-Functional Flowchart is a clear way of showing each team member’s responsibilities and how processes get shared or transferred between different responsible people, teams and departments. Use the best flowchart maker ConceptDraw DIAGRAM with a range of standardized cross-functional flowchart symbols to create the Cross-Functional Flowcharts simply and to visualize the relationship between a business process and the functional units responsible for that process. To draw the most quickly Cross-Functional Flowcharts, Cross Functional Process Maps, or Cross Functional Process Flow Diagrams, start with a Cross-functional flowchart samples and templates from ConceptDraw Solution Park. The ConceptDraw Arrows10 and RapidDraw technologies will be also useful for you in drawing. ConceptDraw DIAGRAM supports designing both types - horizontal and vertical Cross-functional flowcharts. A vertical layout makes the accents mainly on the functional units while a horizontal layout - on the process. If you need a Visio alternative in Mac OS X, try ConceptDraw DIAGRAM. Its interface is very intuitive and it’s actually much easier to use than Visio, yet somehow it’s just as powerful if not more so. ConceptDraw DIAGRAM performs professional quality work and seamless Visio interaction.
Value stream with ConceptDraw DIAGRAM
The Value stream is a totality of all actions on the projection, order composition and production: starting from creation a product project to launching this product, from order to delivery, from extraction of raw materials to ready product manufacturing. Value stream mapping is a process of visualization of these actions and creation of a detailed and graphical map.Cross-functional flowchart landscape, U.S. units
In Cross-Functional Flowchart first step is to determine how many lanes you want to represent and what the lane titles will be. The choice of vertical or horizontal swim lanes landscape comes down to personal choice or just plain “what fits best”. With ConceptDraw, we make that simple by including different swim lanes templates. Professional looking examples and templates of Swimlane Flowchart which help you create Cross Functional Flowcharts rapidly.Flowchart Symbols Accounting. Activity-based costing (ABC) flowchart
The Accounting Flowcharts are helpful and popular kind of flowcharts in a field of business, finance and accounting. The ConceptDraw DIAGRAM diagramming software enhanced with Accounting Flowcharts solution from the Finance and Accounting area of ConceptDraw Solution Park is extremely comfortable for visually explaining the accounting processes and for designing Accounting Flowcharts and Accounting Process Flow Diagrams of any complexity. The library of vector design elements included to Accounting Flowcharts solution provides you with major accounting flowchart symbols, which make the drawing process incredibly easy and convenient. The use of them for designing of such sort of Accounting Flowcharts as the Activity-based costing (ABC) flowcharts will simplify the drawing process and will allow to make these flowcharts in a few minutes in ConceptDraw DIAGRAM. Design easily your own ABC flowcharts to demonstrate in details the relations and logics of activity-based distribution the costs between the company's units and departments.Example of DFD for Online Store (Data Flow Diagram)
Data Flow Diagram (DFD) is a methodology of graphical structural analysis and information systems design, which describes the sources external in respect to the system, recipients of data, logical functions, data flows and data stores that are accessed. DFDs allow to identify relationships between various system's components and are effectively used in business analysis and information systems analysis. They are useful for system’s high-level details modeling, to show how the input data are transformed to output results via the sequence of functional transformations. For description of DFD diagrams are uses two notations — Yourdon and Gane-Sarson, which differ in syntax. Online Store DFD example illustrates the Data Flow Diagram for online store, the interactions between Customers, Visitors, Sellers, depicts User databases and the flows of Website Information. ConceptDraw DIAGRAM enhanced with Data Flow Diagrams solution lets you to draw clear and simple example of DFD for Online Store using special libraries of predesigned DFD symbols.
 Plumbing and Piping Plans
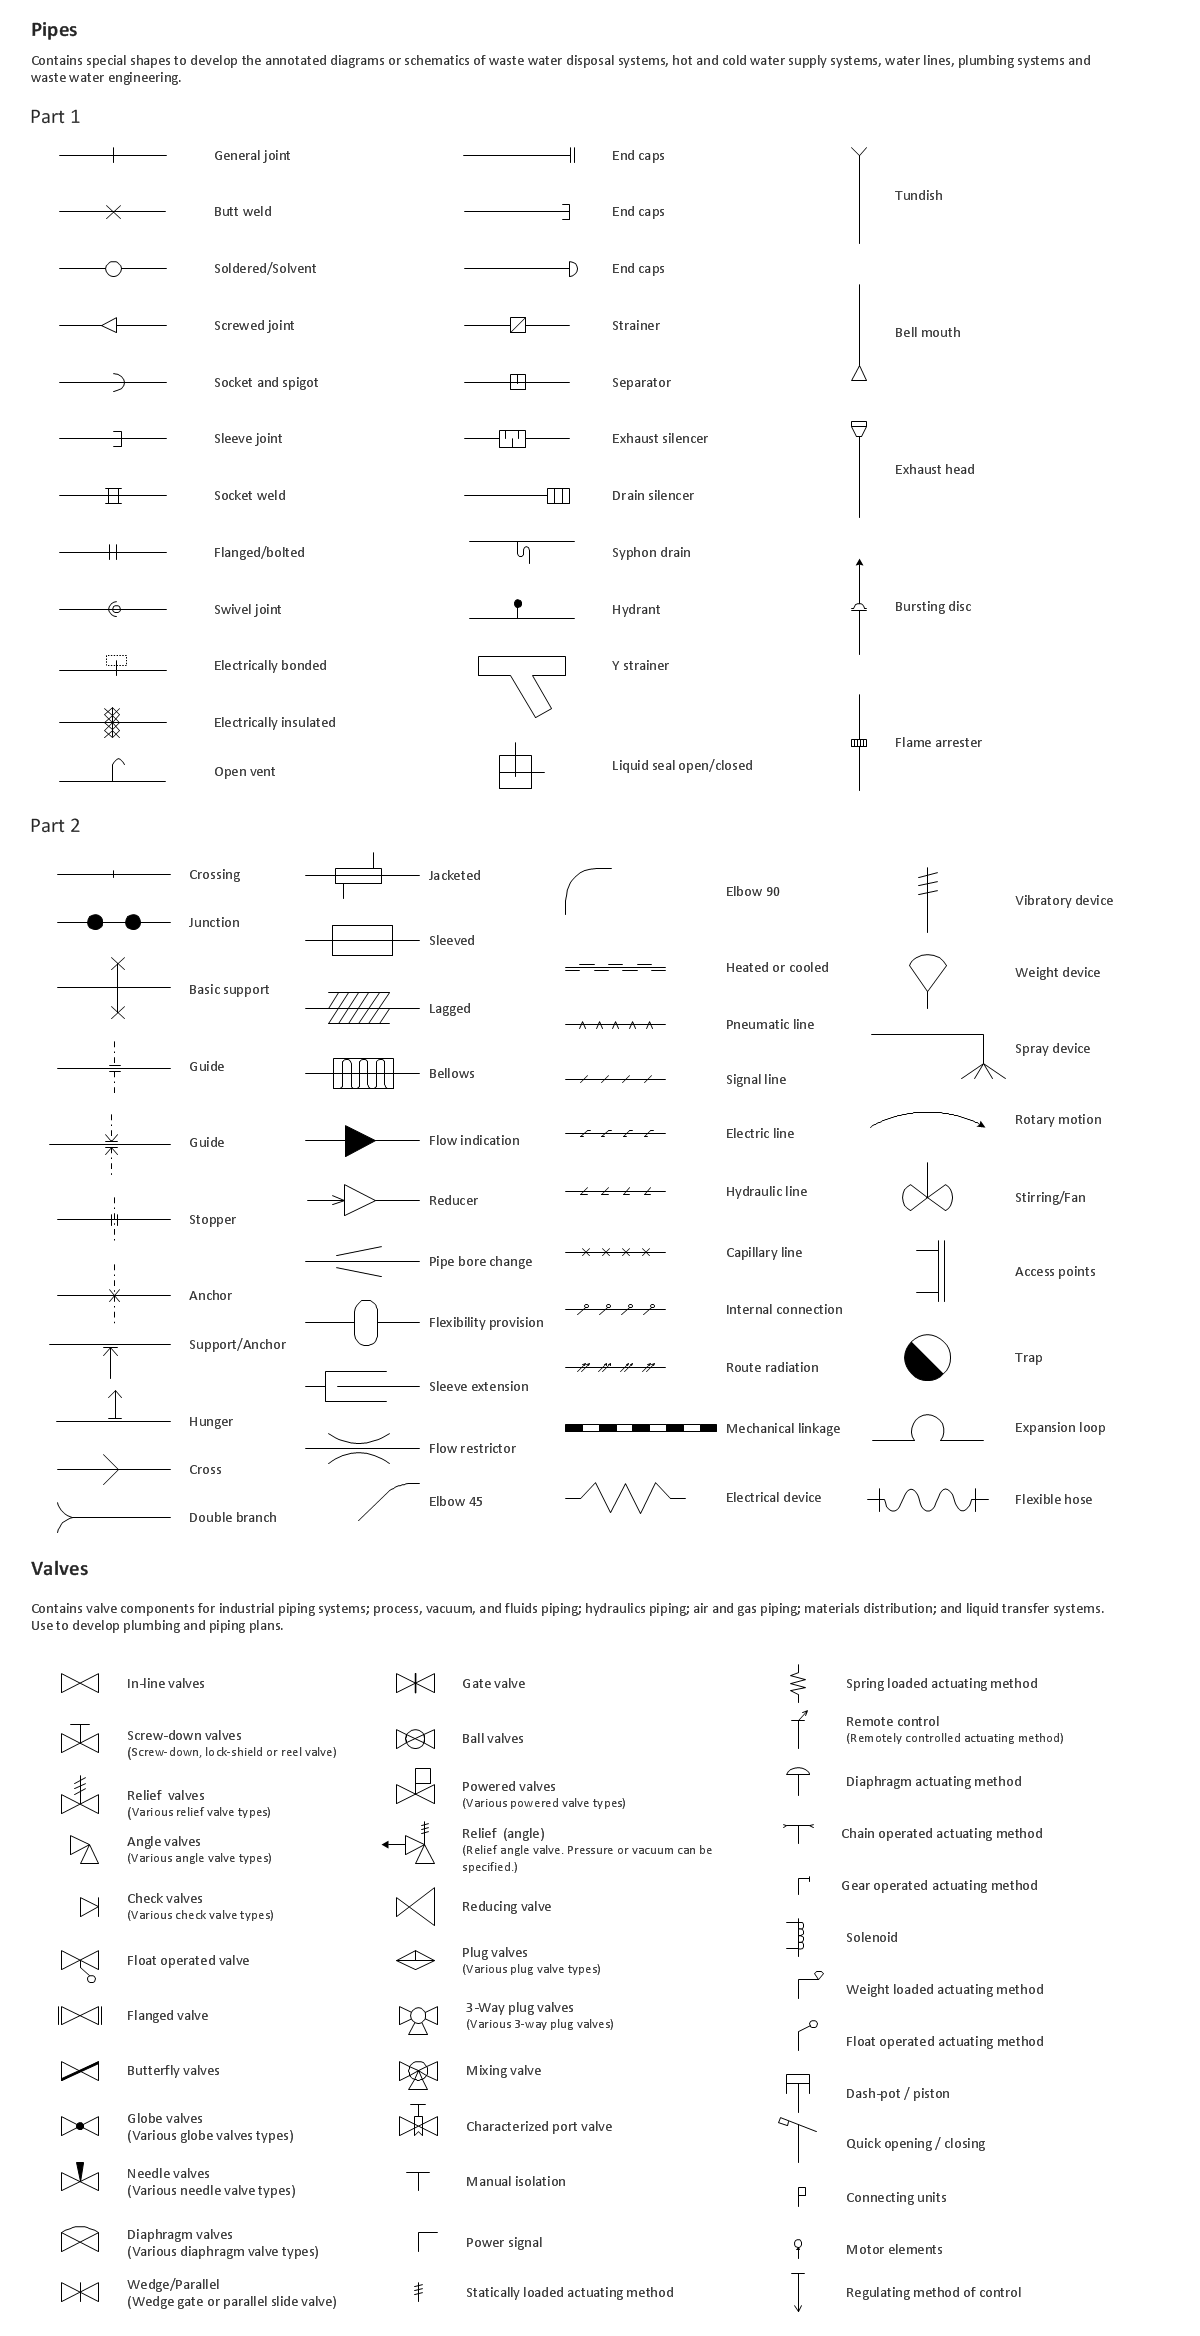
Plumbing and Piping Plans solution extends ConceptDraw DIAGRAM.2.2 software with samples, templates and libraries of pipes, plumbing, and valves design elements for developing of water and plumbing systems, and for drawing Plumbing plan, Piping plan, PVC Pipe plan, PVC Pipe furniture plan, Plumbing layout plan, Plumbing floor plan, Half pipe plans, Pipe bender plans.
Building Drawing. Design Element: Piping Plan
When you are going to build a house or to make repairs of new built home, apartment, office, shop, or to renovate any other premises, in many cases you will need to make the package of drawings, plans and documents, including the such important plans as the Overall floor plan, Interior design plan, Ceiling plan, Electrical system plan, and of course the Plumbing plan, Water supply system plan, and Piping Plan. When choosing between the modern software for building construction, planning and design, we recommend you to select the multifunctional building plan software ConceptDraw DIAGRAM enhanced with Plumbing and Piping Plans solution from the Building Plans area of ConceptDraw Solution Park. This solution provides large variety of examples, samples, quick-start templates and libraries of pipes, plumbing and valves vector design elements for design and construction the Plumbing and Piping Plans, schematics and annotated diagrams for hot and cold water supply systems, water lines and waste water disposal systems.
Building Drawing. Design Element — Plumbing
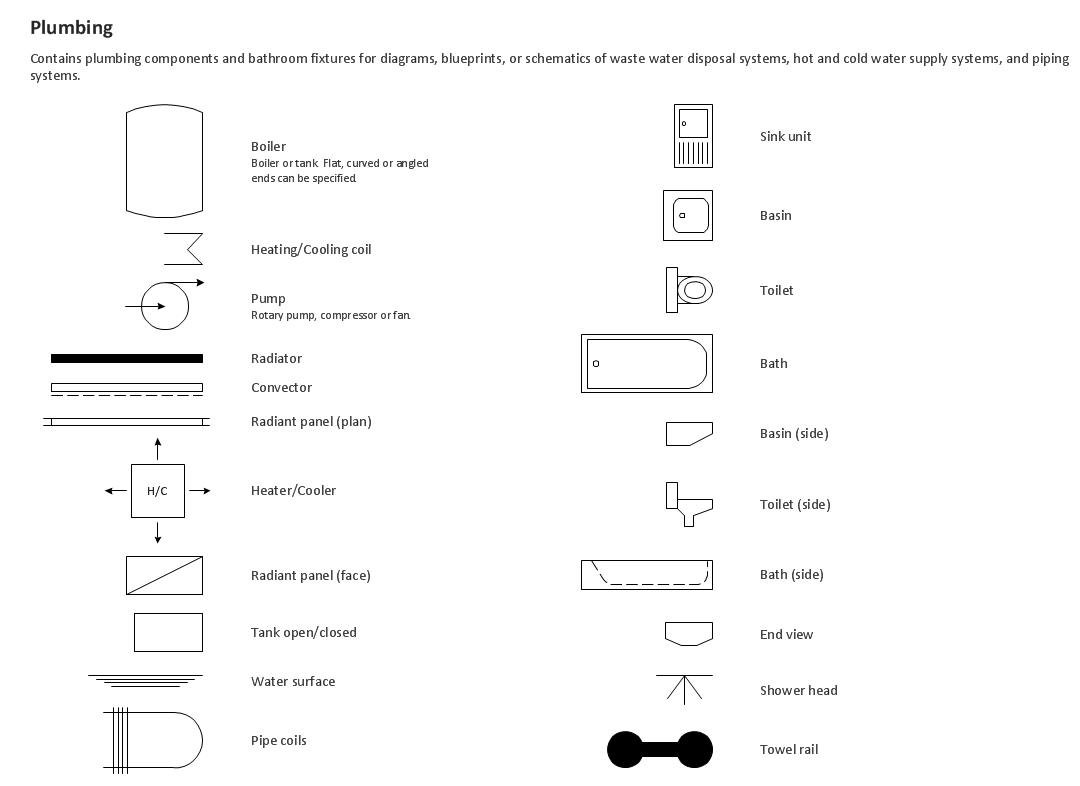
Any repair or replanning usually requires a work with engineering communications and sanitary equipment. This can be the new system's construction or the dismantling of old pipes and plumbing, and then installation the new ones. The reliability of plumbing system depends on many factors, but in any case, a prerequisite is careful planning, competent and qualified project's development, design of necessary Plumbing diagrams, creation the plan of plumbing works, high-quality laying of pipes and correct installation of engineering communications, plumbing and sanitary equipment according to the developed schemes. The key point at the development schemes and plans is the necessity to clearly think over all required plumbing equipment, to choose the types of pipes, a way of montage and to count their quantity. ConceptDraw DIAGRAM software extended with Plumbing and Piping Plans solution is the ease way to create professional-looking Plumbing plans, Piping plans, Water supply system plans, Plumbing system layout plans, thanks to the included plumbing and piping vector design elements.Lean Six Sigma Diagram Software
Lean Six Sigma (LSS) is a well-known in all over the world methodology of quality improvement and business perfection. ConceptDraw DIAGRAM diagramming and vector drawing software is a powerful Lean Six Sigma Diagram Software thanks to the included Value Stream Mapping solution from the Quality Management Area of ConceptDraw Solution Park.- Flow Chart Of Solid Waste Management
- Cross-functional flowchart landscape, US units | Flowchart Of Waste ...
- Make A Creative Flow Chart On Types Of Software Using Waste ...
- Solid Waste Management Process Flow Chart
- Area Charts | Basic Area Charts | Draw A Flow Chart On Waste ...
- Flow Chart Concept Map Of Waste Management
- Waste Water Treatment Plant Eqient Symbols For Flowchart
- Chart With Diagram On Waste Material
- Pie Chart Of Electric Consumption In Waste Wastewater Treatment


