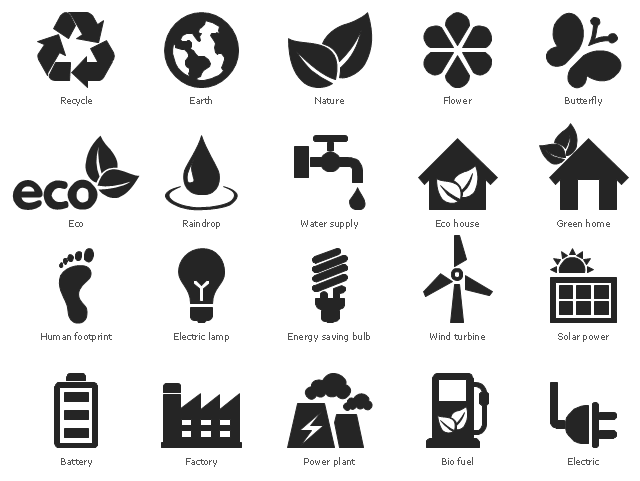
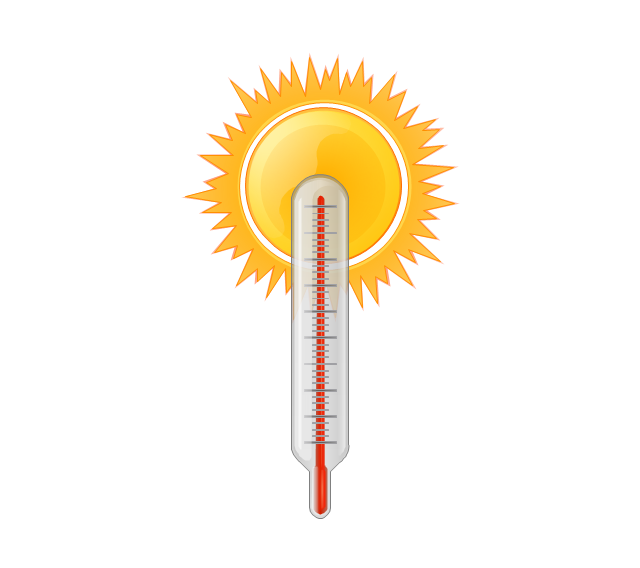
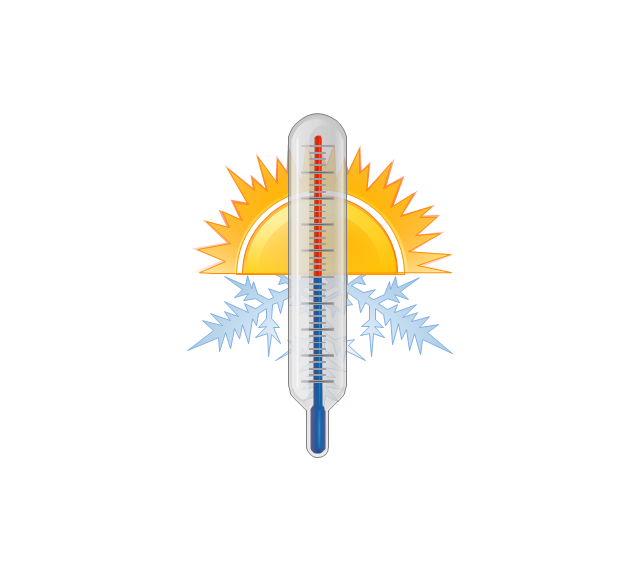
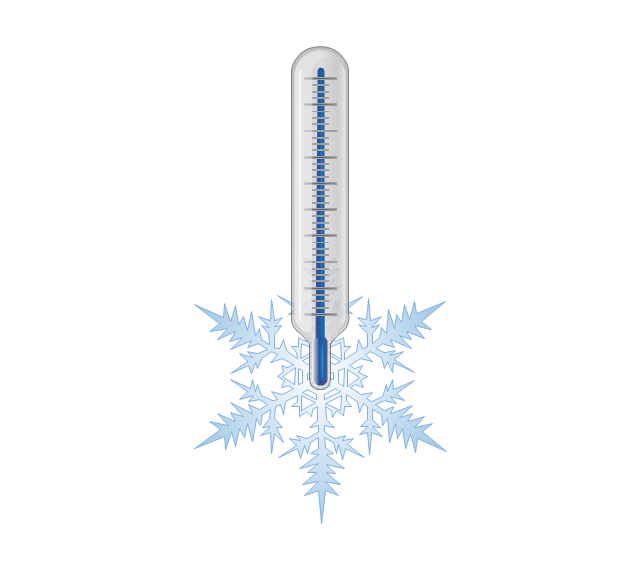
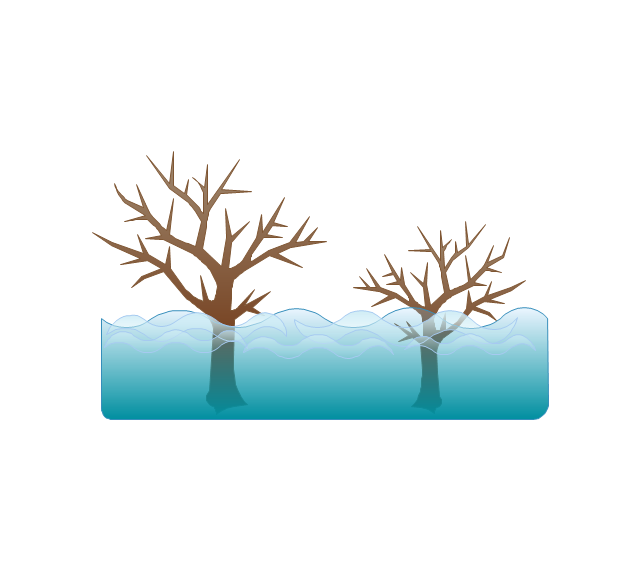
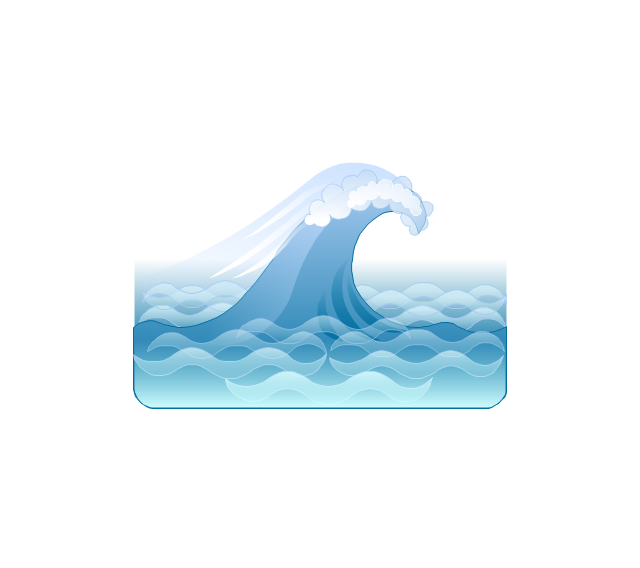
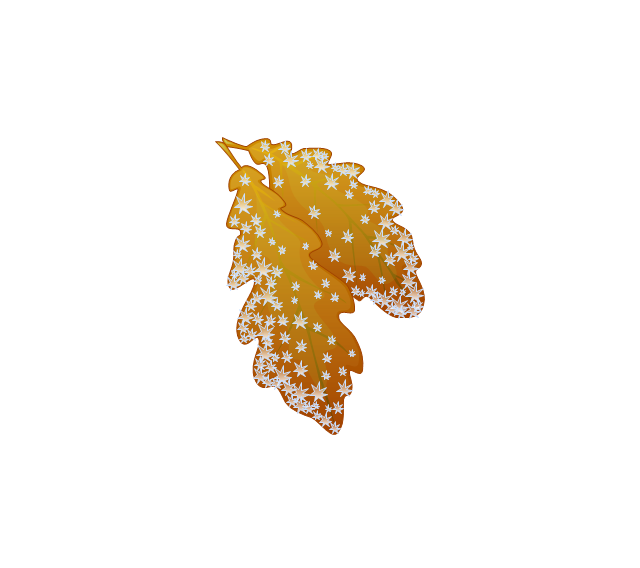
The vector stencils library "Ecology pictograms" contains 20 ecological pictograms.
Use it to draw your eco illustrations, presentations, web pages and infographics.
The example "Design elements - Ecology pictograms" was created using the ConceptDraw PRO diagramming and vector drawing software extended with the Pictorial Infographic solution from the area "What is infographics" in ConceptDraw Solution Park.
The vector stencils library "Ecology pictograms" contains 20 icons of eco symbols. Use it to draw your ecological infographics. The example "Ecology pictograms - Vector stencils library" was created using the ConceptDraw PRO diagramming and vector drawing software extended with the Pictorial infographics solution from the area "What is infographics" in ConceptDraw Solution Park.
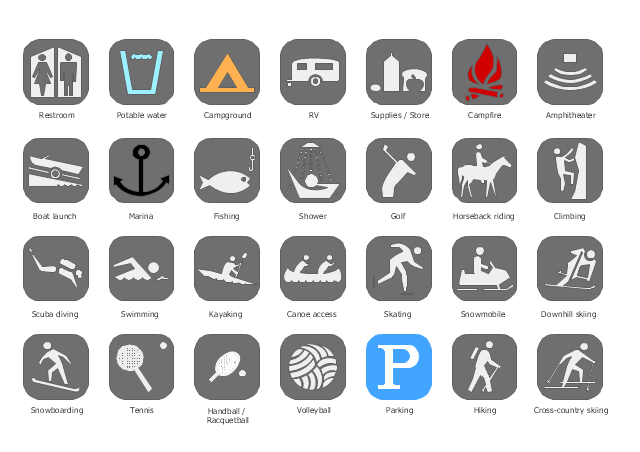
The vector stencils library "Recreation signs" contains 28 pictogram symbols of recreation signs for labeling street and directional maps, locator and tourist maps, road and route maps.
"A tourist sign, often referred to as a brown sign, is a traffic sign whose purpose is to direct visitors to tourist destinations, such as historic buildings, tourist regions, caravan or camp sites, picnic areas, sporting facilities and cultural places such as museums. By international convention, brown signs with white lettering and white pictograms are often used for this purpose. ...
Basically these tourist signs have 3 main applications:
(1) Information signs and signposts that point to important tourist destinations or places of interest in the local area, for example within a village or town.
(2) Standard signs that are used to mark routes with special themes, i.e. so-called tourist or holiday routes.
(3) Tourist signs that herald the presence of nearby landscapes, towns and regions, usually on long distance routes such as motorways. They are not used as direction signs." [Tourist sign. Wikipedia]
The pictograms example "Recreation signs - Vector stencils library" was created using the ConceptDraw PRO diagramming and vector drawing software extended with the Directional Maps solution from the Maps area of ConceptDraw Solution Park.
www.conceptdraw.com/ solution-park/ maps-directional
Design Pictorial Infographics. Design Infographics
In the course of recent decades data visualization went through significant development and has become an indispensable tool of journalism, business intelligence and science. The way visual information may be conveyed is not limited simply to static or dynamic representation, it can also be interactive. Infographics can be conditionally divided into several general levels. Primarily, this is level of visualization of information, its interpretation and association on any ground. Second level can be defined as a visualization of knowledge, depiction of thoughts and ideas in the form of images or diagrams. Finally, the level of data visualization, which processes data arrays in charts, enabling the information to be more clearly perceived. You can also identify the main approaches to the creation of infographics: exploratory and narrative. Exploratory method insists on minimalist design in favor of data precision without unnecessary details and is common for scientific researches and anaElectrical Symbols, Electrical Diagram Symbols
When drawing Electrical Schematics, Electrical Circuit Diagrams, Power Systems Diagrams, Circuit and Wiring Diagrams, Digital and Analog Logic Schemes, you will obligatory need the electrical symbols and pictograms to represent various electrical and electronic devices, such as resistors, wires, transistors, inductors, batteries, switches, lamps, readouts, amplifiers, repeaters, relays, transmission paths, semiconductors, generators, and many more. Today these symbols are internationally standardized, so the diagrams designed using them are recognizable and comprehensible by specialists from different countries. Electrical Engineering Solution included to ConceptDraw Solution Park provides 26 libraries with 926 commonly used electrical schematic and electrical engineering symbols making the reality the easy drawing of Electrical diagrams, schematics and blueprints. Now you need only a few minutes to create great-looking Electrical diagram, simply choose required electrical design elements from the libraries, drag them on the needed places at the document and connect in a suitable way.The vector stencils library "Recreation signs" contains 28 pictogram symbols for labeling the street and locator maps, road and route maps, transit and tourist maps with information signs using the ConceptDraw PRO diagramming and vector drawing software.
"An information sign is a very legibly printed and very noticeable placard that informs people of the purpose of an object, or gives them instruction on the use of something. An example is a traffic sign such as a stop sign.
Information signs have been growing in visibility due to the explosion of sign technologies." [Information sign. Wikipedia]
"A tourist sign, often referred to as a brown sign, is a traffic sign whose purpose is to direct visitors to tourist destinations, such as historic buildings, tourist regions, caravan or camp sites, picnic areas, sporting facilities and cultural places such as museums. By international convention, brown signs with white lettering and white pictograms are often used for this purpose." [Tourist sign. Wikipedia]
The vector stencils library "Recreation signs" is included in the Directional Maps solution from the Maps area of ConceptDraw Solution Park.
Business and Finance Illustrations Example
ConceptDraw Business Finance Illustration examples and libraries contain vector clip art for drawing different Business and Finance Illustrations. You may find Advertising example, Project Management example, Business Model example and many more.The vector stencils library "Weather" contains 17 weather clipart images for drawing illustrations on climate to show cloudiness, air temperature, precipitation, wind.
"Weather is the state of the atmosphere, to the degree that it is hot or cold, wet or dry, calm or stormy, clear or cloudy. Most weather phenomena occur in the troposphere, just below the stratosphere. Weather generally refers to day-to-day temperature and precipitation activity, whereas climate is the term for the average atmospheric conditions over longer periods of time. When used without qualification, "weather", is generally understood to mean the weather of Earth.
Weather is driven by air pressure (temperature and moisture) differences between one place and another. These pressure and temperature differences can occur due to the sun angle at any particular spot, which varies by latitude from the tropics. The strong temperature contrast between polar and tropical air gives rise to the jet stream. Weather systems in the mid-latitudes, such as extratropical cyclones, are caused by instabilities of the jet stream flow. Because the Earth's axis is tilted relative to its orbital plane, sunlight is incident at different angles at different times of the year. On Earth's surface, temperatures usually range ±40°C (−40°F to 100°F) annually. Over thousands of years, changes in Earth's orbit affect the amount and distribution of solar energy received by the Earth and influence long-term climate and global climate change." [Weather. Wikipedia]
The clip art example "Weather - Vector stencils library" was created using the ConceptDraw PRO diagramming and vector drawing software extended with the Nature solution from the Illustration area of ConceptDraw Solution Park.
www.conceptdraw.com/ solution-park/ illustrations-nature
- House tap water supply | Cafe water supply | Flat plumbing plan ...
- Design elements - Ecology pictograms | Ecology pictograms - Vector ...
- Design elements - Ponds and Fountains | Education pictograms ...
- Ecology pictograms - Vector stencils library | How to Draw Pictorial ...
- Ecology pictograms - Vector stencils library | Ecology pictograms ...
- Geography - Vector stencils library | ConceptDraw Solution Park ...
- Recreation Pictogram Symbols
- Management pictograms - Vector stencils library | Management ...
- Medicine and health pictograms - Vector stencils library | Medicine ...
- Design elements - Marketing pictograms | Design elements ...
- Design elements - Travel and tourism pictograms | Design Pictorial ...
- Recreation signs - Vector stencils library | Recreation signs - Vector ...
- Design elements - Winter sports pictograms | Winter Sports ...
- Design elements - Ponds and Fountains | Design elements ...
- Pictograms Design
- Mountain Vector Png
- Winter Sports | Winter sports pictograms - Vector stencils library ...
- Cross-country skiing - Winter sports pictograms | Design elements ...
- Target diagrams - Vector stencils library | Management pictograms ...
- UML Package Diagram. Design Elements | Design Elements for ...
