Waterfall Bar Chart

Competitor Analysis

The vector stencils library "Data-driven charts" contains 13 data-driven graphs and charts: area chart, divided bar diagram, double bar graph, frequency histogram, horizontal bar chart, line graph, percentage ring chart, percentage pie chart, scatter plot, column chart, waterfall chart.
Use it to visualize quantitative data in your data-driven infographics.
The graphs example "Data-driven charts - Vector stencils library" was created using the ConceptDraw PRO diagramming and vector graphics software extended with the Data-driven Infographics solution from the area "What is infographics" of ConceptDraw Solution Park.
Area chart

Divided bar diagram

Double bar graph

Frequency histogram

Horizontal bar graph

Line graph

Percentage ring chart

Pie chart

Percentage pie chart

Ring chart

Scatter plot

Column chart (vertical bar graph)
-data-driven-charts---vector-stencils-library.png--diagram-flowchart-example.png)
Waterfall chart

Fishbone Diagram Problem Solving

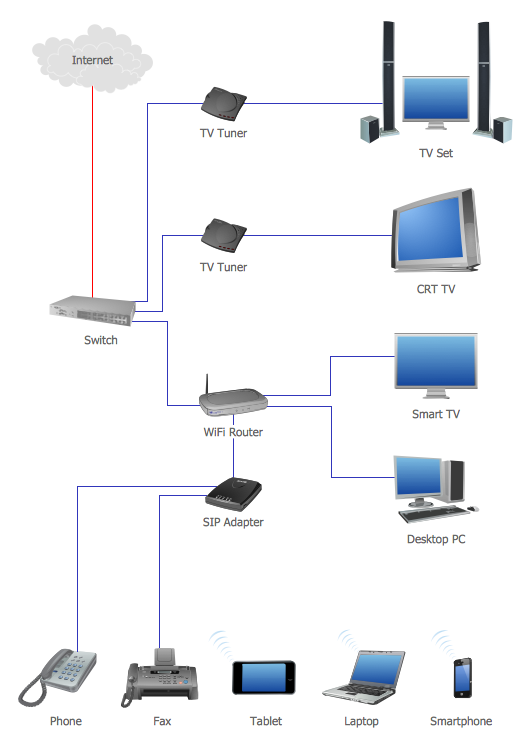
Network Topology Graphical Examples
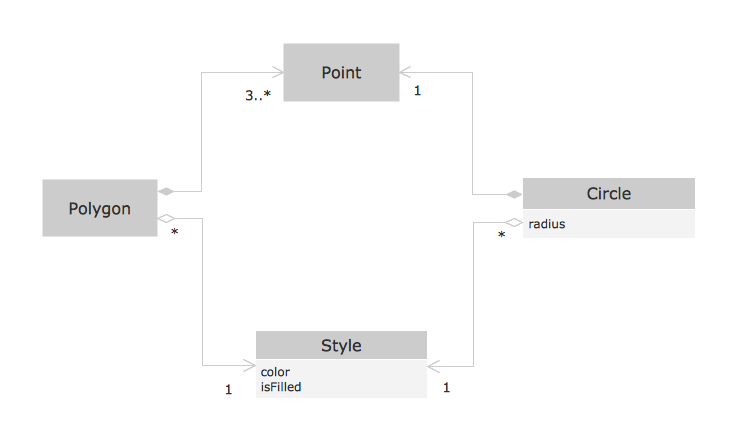
OOSE Method
How to Create a Pyramid Diagram

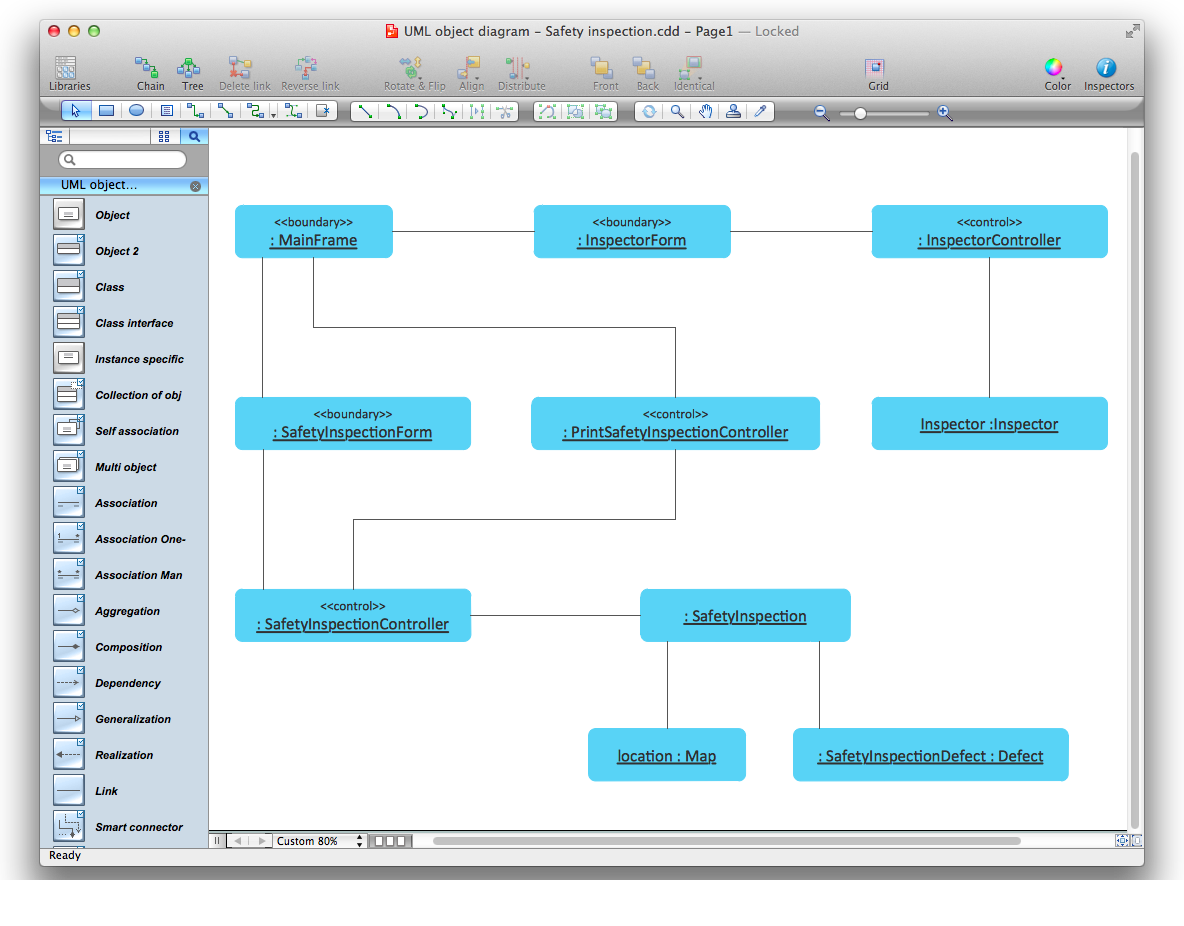
Diagramming Software for Design UML Object Diagrams

 macOS User Interface
macOS User Interface solution extends the ConceptDraw DIAGRAM functionality with powerful GUI software graphic design features and tools. It provides an extensive range of multifarious macOS Sierra user interface design examples, samples and templates, and wide variety of libraries, containing a lot of pre-designed vector objects of Mac Apps icons, buttons, dialogs, menu bars, indicators, pointers, controls, toolbars, menus, and other elements for fast and simple designing high standard user interfaces of any complexity for new macOS Sierra.
Scrum

- SSADM Diagram | Waterfall Bar Chart | Best Program to Make ...
- Atmosphere air composition | Waterfall Bar Chart | Pie Graph ...
- Bar Chart Examples | Sales Growth. Bar Graphs Example | Waterfall ...
- Waterfall Bar Chart | Pie Graph Worksheets | Chart Maker for ...
- Composition Conversion Of Graphics Pie Chart Bar Chart Table
- Waterfall Bar Chart | Process Flowchart | Chart Examples | Describe ...
- Waterfall Bar Chart | Process Flowchart | Software Development ...
- Agile Methodology | SSADM Diagram | Basic Flowchart Symbols ...
- Pie Chart Software | Waterfall Bar Chart | Flow chart Example ...
- How to Create a Bar Chart | Waterfall Bar Chart | Chart Maker for ...