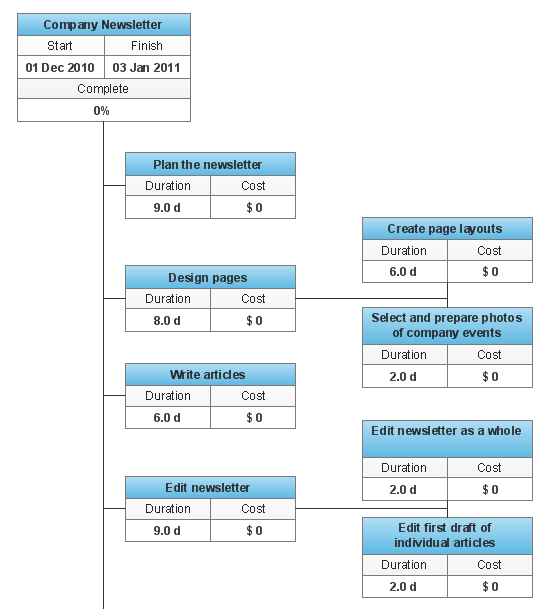
WBS Diagram
Represent a set of planned outcomes that define 100% of the project scope. Create Work Breakdown Structure (WBS) diagram.How to Report Task's Execution with Gantt Chart
ConceptDraw PROJECT’s powerful reporting engine lets you generate a set of tabular reports with just one click, or visualize your project as Radial Tasks Structures, Work Breakdown Structures and Resource Calendars. It also provides you with dynamic Project Dashboards.Org Chart Diagram
ConceptDraw Solution Park creates a single information space for messaging to teams. PM Teams provides project participants and organizations with better tools that assist in task understanding, timeframe understanding, and project events in the entire organization. Improved communication fosters positive team spirit throughout.ConceptDraw Arrows10 Technology
Connecting objects manually in ConceptDraw DIAGRAM is a snap:- points;
- Connecting groups of objects;
- Auto-routing;
- Connectors text;
- Snap to Guides ;
- Quick.
Flowcharts
The Flowcharts solution for ConceptDraw DIAGRAM is a comprehensive set of examples and samples in several varied color themes for professionals that need to represent graphically a process. Solution value is added by the basic flow chart template and shapes' libraries of flowchart notation. ConceptDraw DIAGRAM flow chart creator lets one depict the processes of any complexity and length, as well as design the Flowchart either vertically or horizontally.
Contoh Flowchart
A Flowchart is a graphical representation of the algorithm, process or the step-by-step solution of the problem. There are ten various types of Flowcharts. The ConceptDraw allows you to draw the flowchart of any type.The Contoh Flowchart included to Flowcharts solution are professional looking practical samples and you can quick and easy modify them, print, or publish on web.
ConceptDraw PROJECT Software Overview
ConceptDraw PROJECT is an effective tool for new and experienced users with a fine balance of usability and powerful functionality.Flow Chart
A Flow Chart is a type of diagram which visualizes a process, algorithm of a program or workflow. The steps / operations are represented as boxes of various types and are connected by arrows which show the flow of the process.But how to design a Flow Chart fast and easy? We recommend to use a powerful ConceptDraw DIAGRAM diagramming and vector drawing software extended with Flowcharts Solution from the "Diagrams" Area of ConceptDraw Solution Park.
- Wbs Flowchart
- | Flowcharts | Wbs Sample Product Launch
- | How to Report Task's Execution with Gantt Chart | Wbs Marketing ...
- PM Easy | Wbs Block Diagram
- WBS Diagram | How to Report Task's Execution with Gantt Chart ...
- Wbs Projects Landscaping
- Epc Projects Wbs Templates
- | Exemple Wbs Product Launch
- Wbs Example For Epc Projects
- Wbs For Recreation Park
- ERD | Entity Relationship Diagrams, ERD Software for Mac and Win
- Flowchart | Basic Flowchart Symbols and Meaning
- Flowchart | Flowchart Design - Symbols, Shapes, Stencils and Icons
- Flowchart | Flow Chart Symbols
- Electrical | Electrical Drawing - Wiring and Circuits Schematics
- Flowchart | Common Flowchart Symbols