How To Show Project Progress Peport on Web
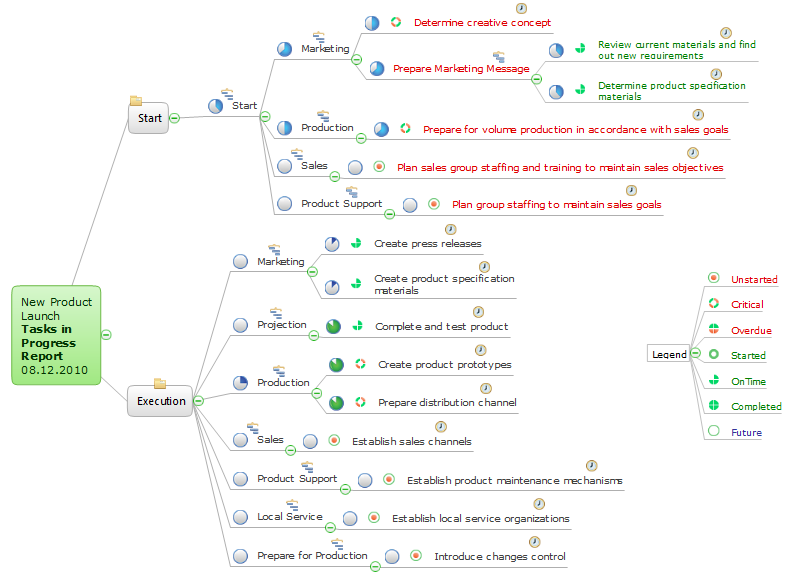
Project progress on web: delivering project status to remote teams and stakeholders via Skype.
Gantt chart examples
All Gantt charts were made using ConceptDraw PROJECT. ConceptDraw PROJECT works both on Windows and Mac OS X. It allows to schedule a voluntary number of projects in a single Workspace document and lets easily share tasks and resources among them. ConceptDraw PROJECT shares files among Windows and Mac OS X.Software Diagrams
Modern software development begins with designing different software diagrams and also uses a large amount of diagrams in project management and creation graphic documentation. Very popular diagrams that depict a work of applications in various cuts and notations, describe databases and prototype Graphical User Interfaces (GUIs). Software engineering specialists and software designers prefer to use special technical and business graphics tools and applications for easy creation diagrams. One of the most popular is ConceptDraw DIAGRAM diagramming and vector drawing software. ConceptDraw DIAGRAM offers the possibility of drawing with use of wide range of pre-drawn shapes and smart connectors, which allow to focus not on the process of drawing, but on the task's essence. It is a perfect application for design and document development, planning tasks, visualization of data, design the databases, object-oriented design, creation flowcharts of algorithms, modeling business processes, project management, automation of management and development processes, and for many other tasks.Software development with ConceptDraw DIAGRAM
Modern software development requires creation of large amount of graphic documentation, these are the diagrams describing the work of applications in various notations and cuts, also GUI design and documentation on project management. ConceptDraw DIAGRAM technical and business graphics application possesses powerful tools for software development and designing technical documentation for object-oriented projects. Solutions included to the Software Development area of ConceptDraw Solution Park provide the specialists with possibility easily and quickly create graphic documentation. They deliver effective help in drawing thanks to the included package of templates, samples, examples, and libraries with numerous ready-to-use vector objects that allow easily design class hierarchies, object hierarchies, visual object-oriented designs, flowcharts, GUI designs, database designs, visualize the data with use of the most popular notations, including the UML and Booch notations, easy manage the development projects, automate projection and development.HelpDesk
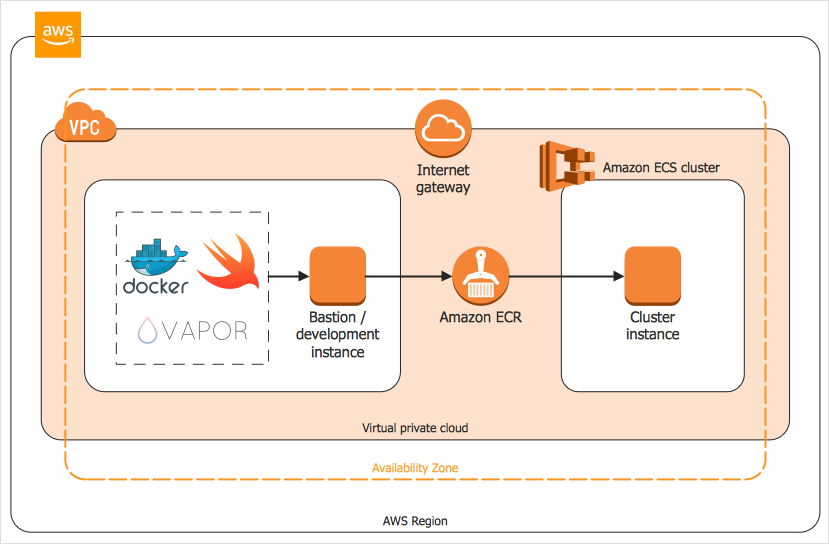
How to Create an AWS Architecture Diagram
Displaying an Amazon Web Service (AWS) cloud actually requires large amounts of attention to detail. Every element of technology has to be addressed: software, middle ware, transaction processing, scaling, data storage; the complete list is staggering. Using the ConceptDraw AWS Architecture Diagrams solution makes much easier the work on documenting the Amazon Web Service architecture. The ConceptDraw AWS Architecture Diagrams solution includes icons, sample and templates for some Amazon Web Services products and resources, to be used when buiding architecture diagrams. The icons are simple so that user can easily incorporate them in his drawings. AWS Architecture Diagrams can be used in presentations, datasheets, or any other technical visualizations.HelpDesk
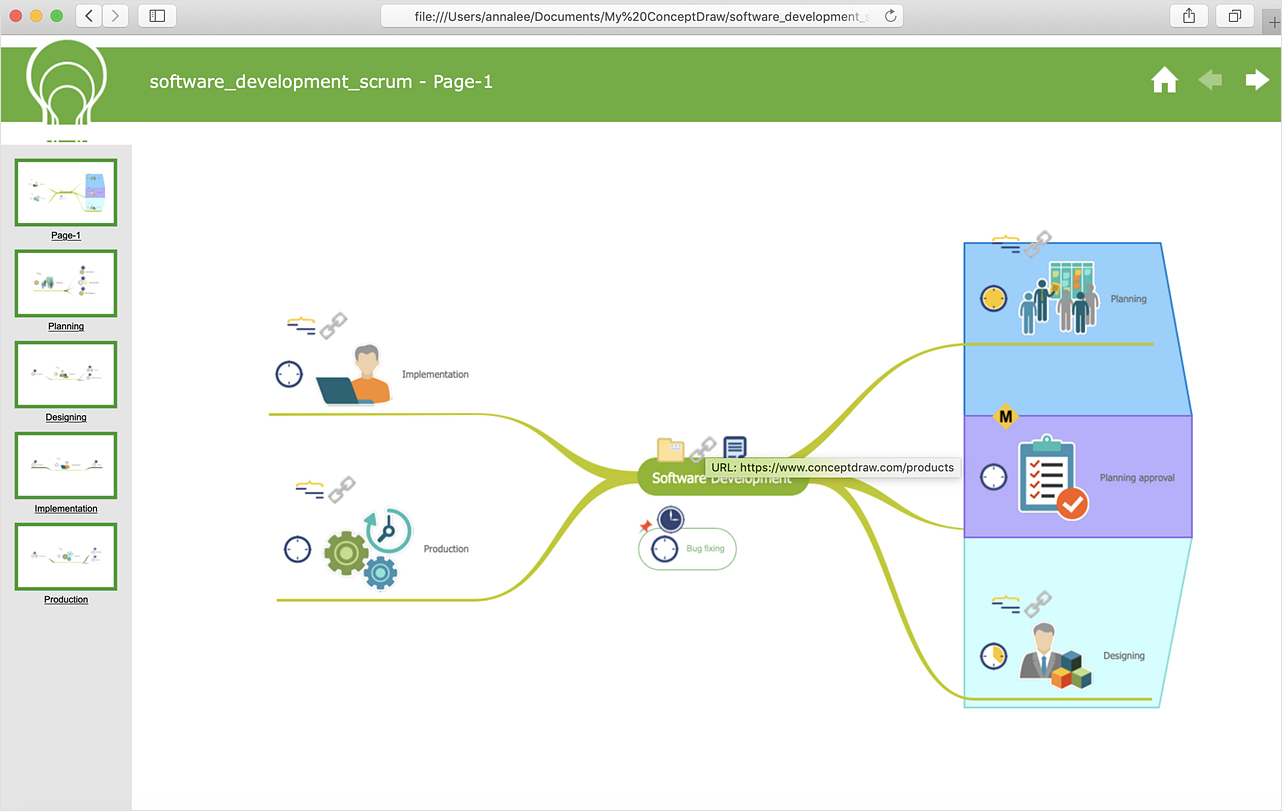
How to Share Mind Maps via Internet
ConceptDraw MINDMAP provides a variety of export capabilities to help with that situation. Exporting the mind map to HTML format, preserving the links so they can be used to download documents.Garrett IA Diagrams with ConceptDraw DIAGRAM
Garrett IA diagrams are used at development of Internet-resources, in particulars at projecting of interactions of web-resource elements. The diagram of information architecture of the web resource which is constructed correctly with necessary details presents to developers the resource in comprehensible and visual way.Gantt Chart Software
The Gantt Chart is the main interface in ConceptDraw PROJECT. It summarizes the tasks in your project and presents them graphically so you can easily view your progress.Business diagrams & Org Charts with ConceptDraw DIAGRAM
The business diagrams are in great demand, they describe the business processes, business tasks and activities which are executed to achieve specific organizational and business goals, increase productivity, reduce costs and errors. They let research and better understand the business processes. ConceptDraw DIAGRAM is a powerful professional cross-platform business graphics and business flowcharting tool which contains hundreds of built-in collections of task-specific vector stencils and templates. They will help you to visualize and structure information, create various Business flowcharts, maps and diagrams with minimal efforts, and add them to your documents and presentations to make them successful. Among them are Data flow diagrams, Organization charts, Business process workflow diagrams, Audit flowcharts, Cause and Effect diagrams, IDEF business process diagrams, Cross-functional flowcharts, PERT charts, Timeline diagrams, Calendars, Marketing diagrams, Pyramids, Target diagrams, Venn diagrams, Comparison charts, Analysis charts, Dashboards, and many more. Being a cross-platform application, ConceptDraw DIAGRAM is very secure, handy, free of bloatware and one of the best alternatives to Visio for Mac users.
Internet solutions with ConceptDraw DIAGRAM
ConceptDraw is a good means of visualization of information of any kind as it features powerful graphic capabilities. The conception of using ConceptDraw and open formats by the programs that work with Internet can be used for displaying any data and any structure in Internet.Construction Project Chart Examples
ConceptDraw PROJECT provides a set of construction Gantt chart examples. Project manager requires task tracking, and project examples best approach to start. Make your project applying one of our ready-made examples.Business Process Modeling Notation
ConceptDraw DIAGRAM is a software for simplу depicting the business processes based on BPMN 2.0. Business Process Diagrams Cross-Functional-Flowcharts, Workflows, Process Charts, IDEF0 and IDEF2, Timeline, Calendars, Gantt Charts, Business Process Modeling, Audit and Opportunity Flowcharts and Mind Maps (presentations, meeting agendas).In searching of alternative to MS Visio for MAC and PC with ConceptDraw DIAGRAM
Undoubtedly MS Visio is a powerful and multifunctional tool, but however at times occur the instances, when it turns unable of meeting certain users' requirements. At this cases you may need to use an alternative program software, preferably it will be simple, convenient, and at the same time powerful and professional. In searching the alternative to MS Visio for MAC and PC we recommend you to pay attention for ConceptDraw DIAGRAM software, which was developed to satisfy all your drawing needs and requirements. It is a fully-functioned alternative product to MS Visio for both platforms. ConceptDraw DIAGRAM software has many advantages, the main among them are the cross-platform compatibility, a reasonable price, widespread ConceptDraw Solution Park with huge variety of different solutions that offer numerous libraries of specialized vector objects, useful examples, samples, and quick-start templates, extensive import / export capabilities, built-in script language, MS Visio support and certainly free technical support.ConceptDraw PROJECT Project Management Software Tool
ConceptDraw PROJECT is simple project management software. If you are on the fast track in your career and start facing such challenges as coordination many people, coordination tasks and works, manage project with a great deal of time and money involved - it is the right time to get Project management tool involved in your work.HelpDesk
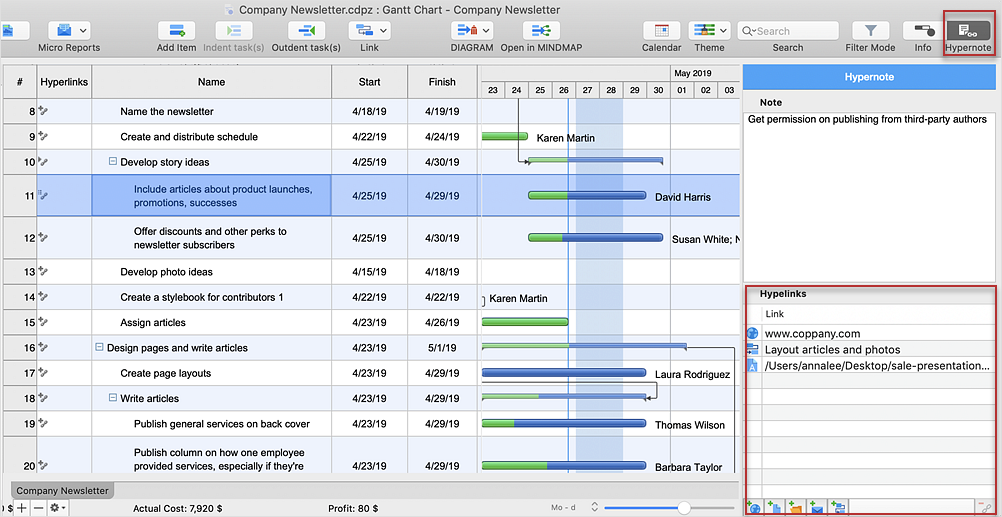
How to Add Several Hyperlinks to a Single Project Task
The number of hyperlinks, you can add to each project item in ConceptDraw PROJECT file is unlimited.- Web Based Diagram Tool
- Erd Diagram For Web Based Event Management Project
- Web Based Diagramming Tool
- Collaboration Diagram For Web Based System
- Basic Flowchart Symbols and Meaning | Construction Project Chart ...
- Diagramming software for Amazon Web Service icon set: Data Base ...
- Diagram Of Web Based Marketing
- How To create Diagrams for Amazon Web Services architecture ...
- Gantt Chart Web
- ConceptDraw PRO - Organizational chart software | Amazon Web ...
- Contoh Flowchart | Flow chart Example. Warehouse Flowchart | How ...
- Er Diagram For Work Flow Based Project
- Status Dashboard | PM Dashboards | How to Create Project ...
- Dfd For Web Application
- How to Activate ConceptDraw After Purchasing from the Web Store ...
- PM Easy | How to Report Task's Execution with Gantt Chart | Garrett ...
- Process Flowchart | How to Publish Project Reports on the Web ...
- How to Publish Project Reports on the Web Using ConceptDraw ...
- Process Flowchart | Diagramming Software for Design UML ...
- How to Publish Project Reports on the Web Using ConceptDraw ...


