Business diagrams & Org Charts with ConceptDraw DIAGRAM
The business diagrams are in great demand, they describe the business processes, business tasks and activities which are executed to achieve specific organizational and business goals, increase productivity, reduce costs and errors. They let research and better understand the business processes. ConceptDraw DIAGRAM is a powerful professional cross-platform business graphics and business flowcharting tool which contains hundreds of built-in collections of task-specific vector stencils and templates. They will help you to visualize and structure information, create various Business flowcharts, maps and diagrams with minimal efforts, and add them to your documents and presentations to make them successful. Among them are Data flow diagrams, Organization charts, Business process workflow diagrams, Audit flowcharts, Cause and Effect diagrams, IDEF business process diagrams, Cross-functional flowcharts, PERT charts, Timeline diagrams, Calendars, Marketing diagrams, Pyramids, Target diagrams, Venn diagrams, Comparison charts, Analysis charts, Dashboards, and many more. Being a cross-platform application, ConceptDraw DIAGRAM is very secure, handy, free of bloatware and one of the best alternatives to Visio for Mac users.
HelpDesk
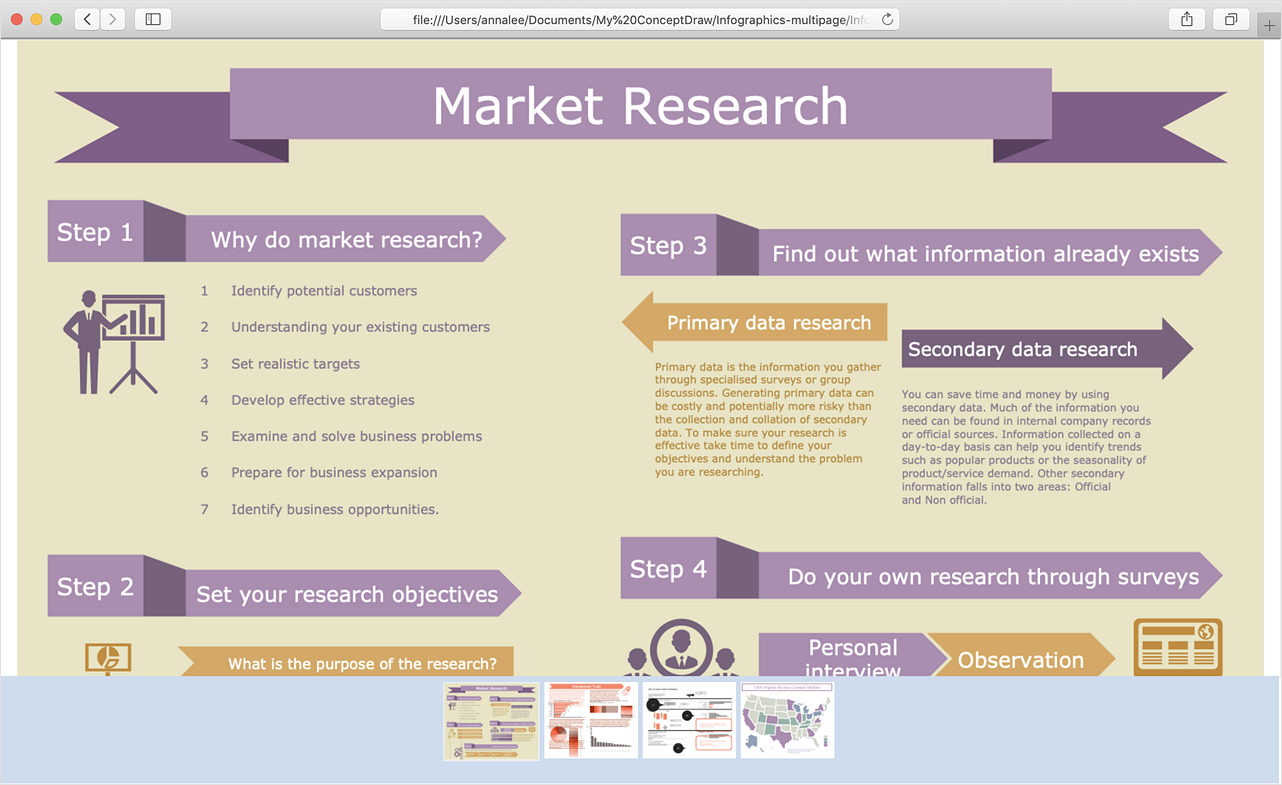
How to Make a Web Page from Infographics
Create your own original marketing illustrations and infographics, presentation slides, website, and blog pages using ConceptDraw DIAGRAM.HelpDesk
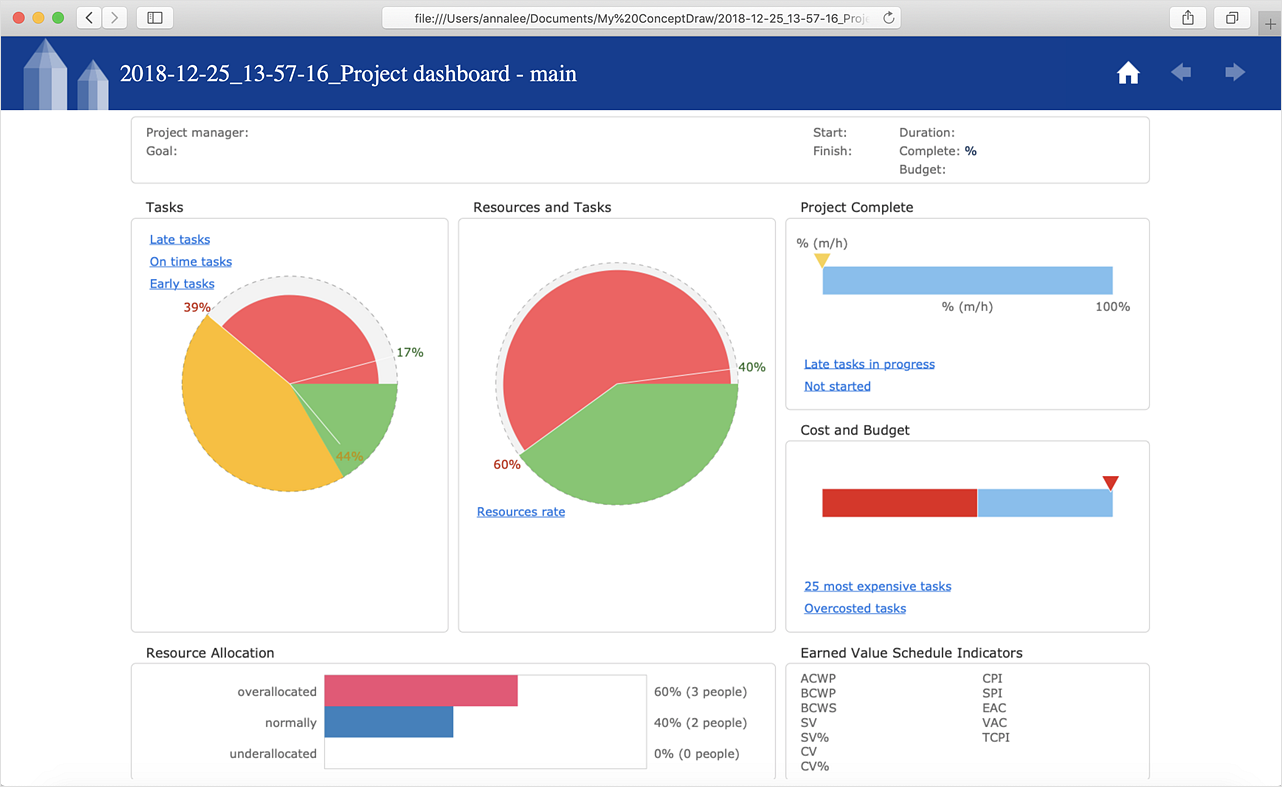
How to Publish Project Reports to a Web Site
Reporting is an important part of project management. Every project manager is regularly asked how the project is progressing. ConceptDraw Office offers different ways in which to provide a project status.HelpDesk
How to Create a Time Series Dashboard
Time Series Dashboard means integration of some type of diagrams: Line Charts, Bar Charts, Column Charts, and Dot Plots on a single space. The ConceptDraw Time Series Dashboard solution can be used to create the interactive Time Series dashboard. The libraries of Time Series Charts solution contain the Live Objects, that can change their appearance depending on the external data. Each chart from the Time Series dashboard displays particular source data. You can include Time Series Charts in your business or technical dashboards to show and compare the items changing over time.HelpDesk
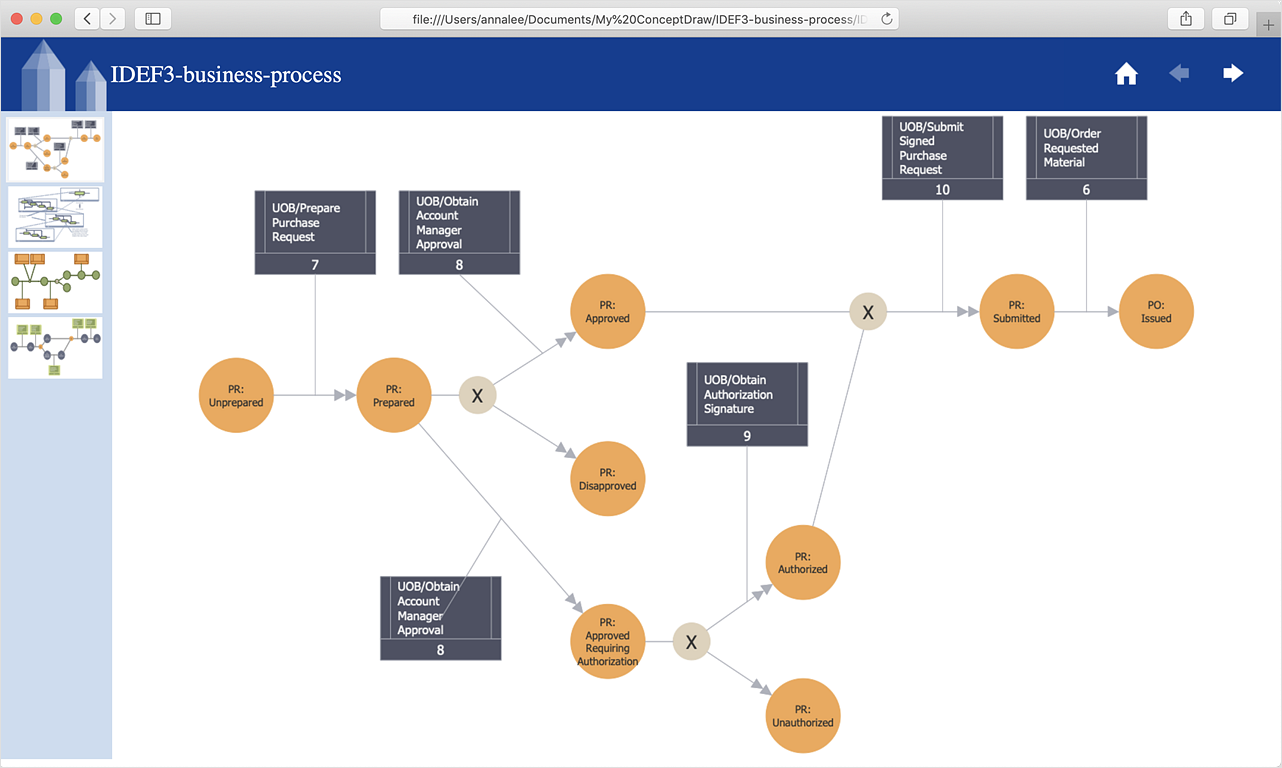
How to Save a Diagram as a Web Page
Using ConceptDraw DIAGRAM , you can save diagrams as a Web pages. ConceptDraw DIAGRAM adds the HTML tags that are needed to display your diagrams in a Web browser, so all you have to do is design their appearance.HelpDesk
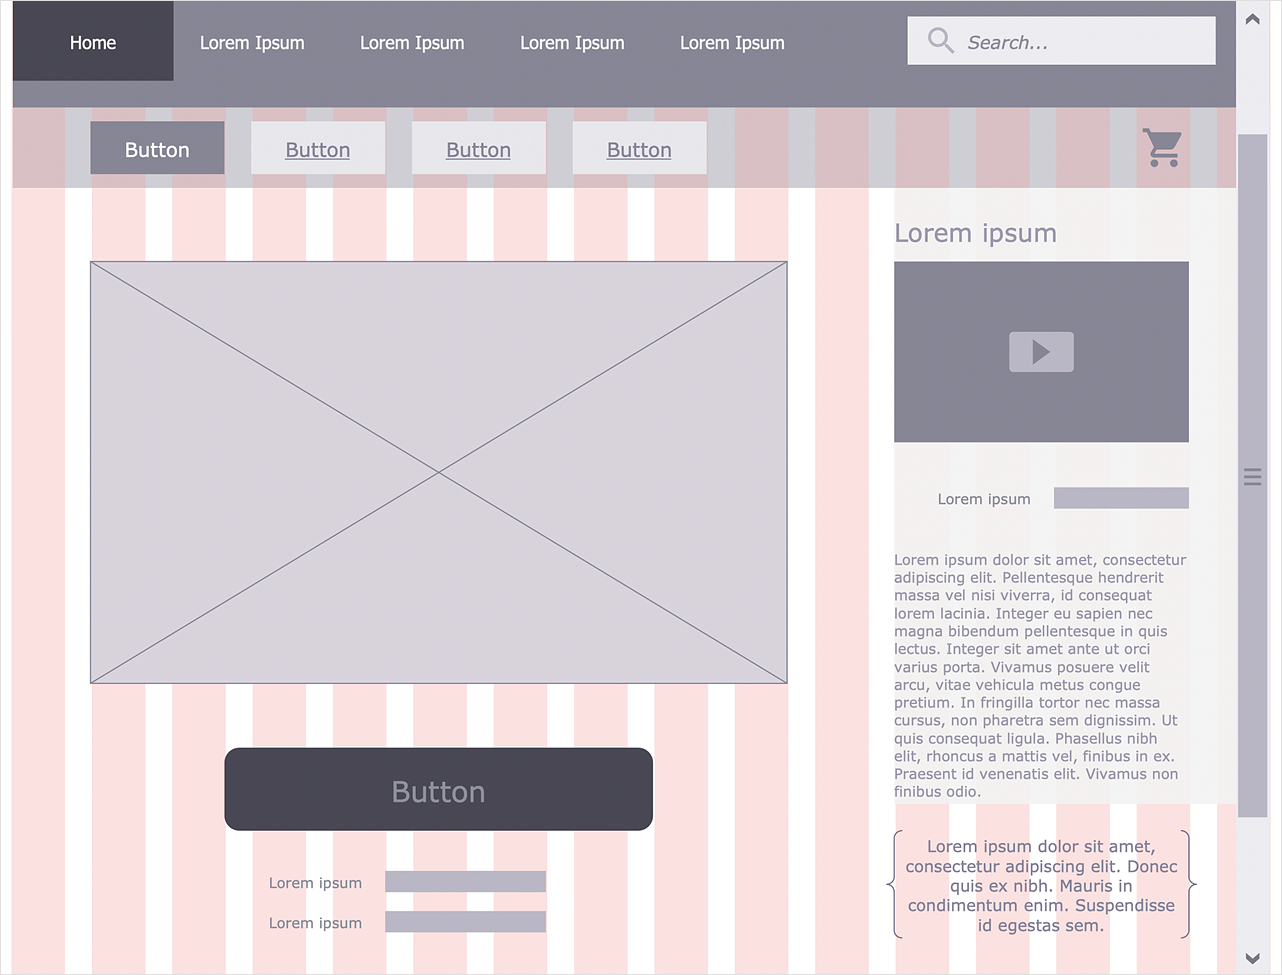
How to Develop Website Wireframes
Website design is a rather complicated process. The development of a website wireframe is an important step in any screen design process. The first step of this process before coding can start, a web designer creates a website wireframe — a mock-up for what will be displayed on the screen when navigating through the web site pages. A wireframe design always includes three components: Information design, navigation design, and interface design. The configuration of these components depends on the business model of the website. The Website Wireframing tools provided with ConceptDraw Website Wireframe solution helps to define the information hierarchy of website design, making it easier for web-developers to plan the layout according to how a site visitor has to process the information.
 ConceptDraw Solution Park
ConceptDraw Solution Park collects graphic extensions, examples and learning materials
In searching of alternative to MS Visio for MAC and PC with ConceptDraw DIAGRAM
Undoubtedly MS Visio is a powerful and multifunctional tool, but however at times occur the instances, when it turns unable of meeting certain users' requirements. At this cases you may need to use an alternative program software, preferably it will be simple, convenient, and at the same time powerful and professional. In searching the alternative to MS Visio for MAC and PC we recommend you to pay attention for ConceptDraw DIAGRAM software, which was developed to satisfy all your drawing needs and requirements. It is a fully-functioned alternative product to MS Visio for both platforms. ConceptDraw DIAGRAM software has many advantages, the main among them are the cross-platform compatibility, a reasonable price, widespread ConceptDraw Solution Park with huge variety of different solutions that offer numerous libraries of specialized vector objects, useful examples, samples, and quick-start templates, extensive import / export capabilities, built-in script language, MS Visio support and certainly free technical support.HelpDesk
How to Activate ConceptDraw After Purchasing from the Web Store
Here you will find an explanation of how activation works when ConceptDraw products are purchased from the ConceptDraw web site. You do not have to manually activate your software. Your license key is saved in your account. Your license is automatically added to your ConceptDraw.com account and saved there permanently. Thus you don’t have to worry about losing your license if your computer crashes or you want to install on a second system.HelpDesk
How to Create an AWS Architecture Diagram
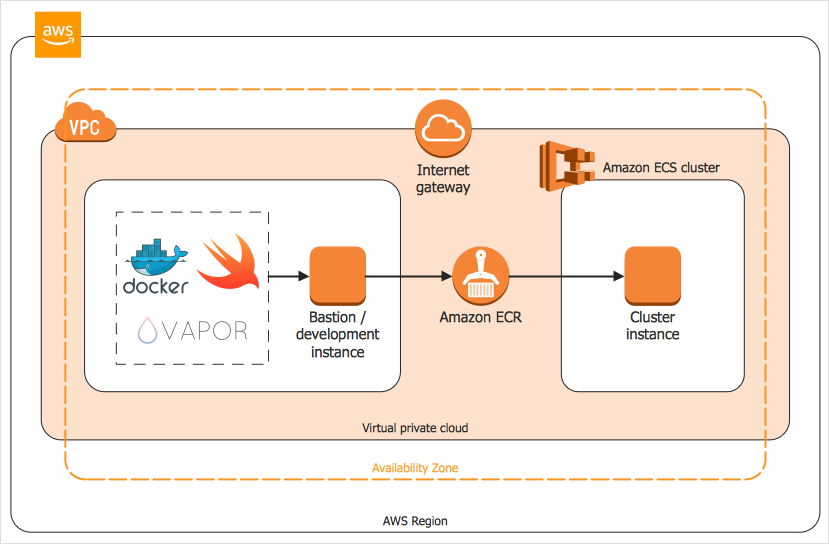
Displaying an Amazon Web Service (AWS) cloud actually requires large amounts of attention to detail. Every element of technology has to be addressed: software, middle ware, transaction processing, scaling, data storage; the complete list is staggering. Using the ConceptDraw AWS Architecture Diagrams solution makes much easier the work on documenting the Amazon Web Service architecture. The ConceptDraw AWS Architecture Diagrams solution includes icons, sample and templates for some Amazon Web Services products and resources, to be used when buiding architecture diagrams. The icons are simple so that user can easily incorporate them in his drawings. AWS Architecture Diagrams can be used in presentations, datasheets, or any other technical visualizations.- Examples of Flowcharts, Org Charts and More | How to Draw an ...
- ConceptDraw PRO - Organizational chart software | Create ...
- Business diagrams & Org Charts with ConceptDraw PRO ...
- Organizational Structure | Organizational Charts with ConceptDraw ...
- Business diagrams & Org Charts with ConceptDraw PRO | Pyramid ...
- Business diagrams & Org Charts with ConceptDraw PRO | Basic ...
- Diagramming tool - Amazon Web Services and Cloud Computing ...
- Process Flowchart | Organizational chart - University leadership ...
- Organizational chart - University leadership | Example of ...
- System Organisation Design Using Dfd
- Diagramming software for Amazon Web Service icon set: Data Base ...
- AWS Simple Icons for Architecture Diagrams | ConceptDraw ...
- Organizational Structure | How to Draw an Organization Chart ...
- Software Development | Diagramming software for Amazon Web ...
- Organizational chart - University leadership | SWOT analysis for a ...
- Example Of A Grant Chart For Website Development
- Remote Projects in Corporate Strategy | Example of Organizational ...
- Organizational Charts | PM Teams | Management | Organization ...
- ConceptDraw PRO - Organizational chart software | Business ...
- Gantt charts for planning and scheduling projects | Examples of ...

