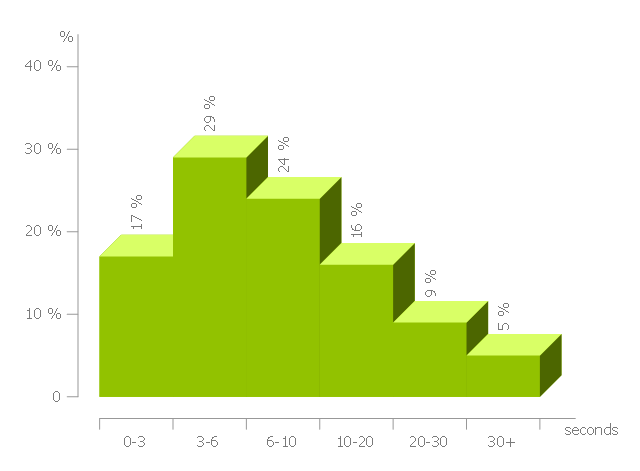
This histogram sample shows the frequency distribution of web page load time.
"Web performance optimization, WPO, or website optimization is the field of knowledge about increasing the speed in which web pages are downloaded and displayed on the user's web browser. ...
With the average internet speed now increasing globally, it's fitting for website administrators and "webmasters" to consider the time it takes for websites to render for the visitor.
Faster website download speeds have been shown to increase visitor retention and loyalty and user satisfaction, especially for users with slow internet connections and those on mobile devices. Web performance also leads to less data travelling across the web, which in turn lowers a website's power consumption and environmental impact. Some aspects which can affect the speed of page load include Browser/ Server Cache, Image Optimization and also encryption (for example SSL), which can affect the time it takes for pages to render." [Web performance optimization. Wikipedia]
The histogram example "Page load time" was created using the ConceptDraw PRO diagramming and vector drawing software extended with the Histograms solution from the Graphs and Charts area of ConceptDraw Solution Park.
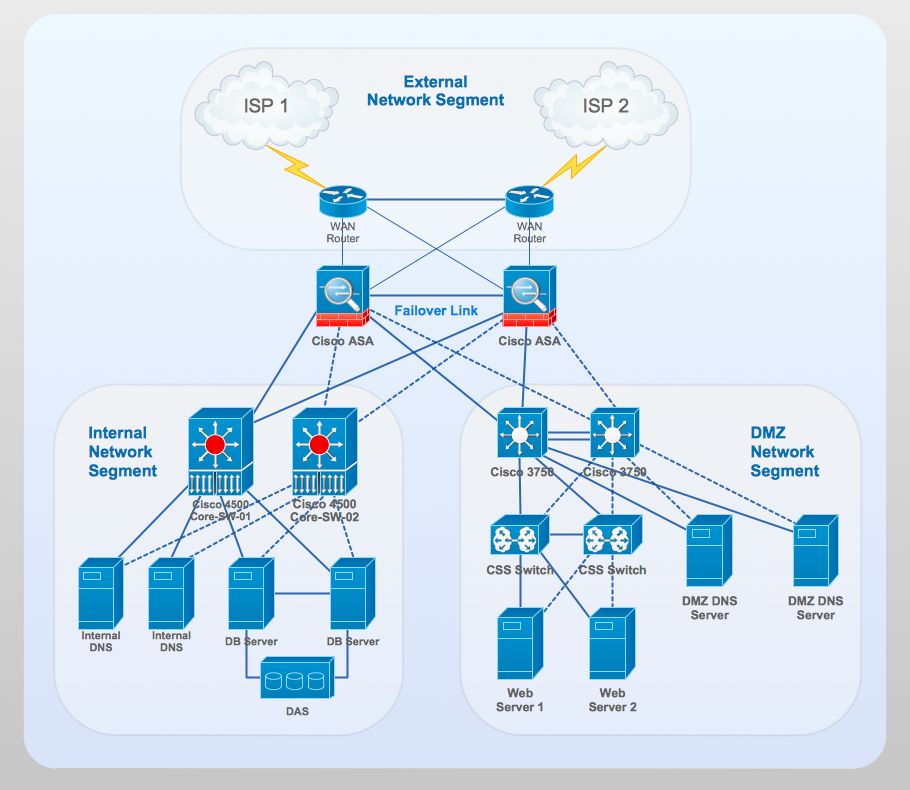
Network Gateway Router
Special libraries of highly detailed, accurate shapes and computer graphics, servers, hubs, switches, printers, mainframes, face plates, routers etc.
 Business Process Mapping
The Business Process Mapping solution for ConceptDraw PRO is for users involved in process mapping and creating SIPOC diagrams.
 Business Process Diagrams
Business Process Diagrams solution extends the ConceptDraw PRO BPM software with RapidDraw interface, templates, samples and numerous libraries based on the BPMN 1.2 and BPMN 2.0 standards, which give you the possibility to visualize equally easy simple and complex processes, to design business models, to quickly develop and document in details any business processes on the stages of project’s planning and implementation.
 Business Process Workflow Diagrams
The Business Process Workflow Diagrams solution enhances the ConceptDraw PRO v10 functionality with predesigned examples, samples and a numerous collection of predesigned vector objects of workflow chart elements, icons, arrows, connectors, and varied wor
- Page load time | Histograms
- Page load time - Frequency histogram | Histogram Chart | Make a ...
- Page load time - Frequency histogram | How to Draw a Histogram in ...
- Chart Examples | How to Draw a Histogram in ConceptDraw PRO ...
- Histograms | Histogram Chart | How to Draw a Histogram in ...
- Histograms | Making a Histogram | How Do You Make a Histogram ...
- Travelling to the Gallery | Travel and tourism pictograms - Vector ...
- Website traffic dashboard | Composition Dashboard | Website ...
- Website traffic dashboard | Website metrics - Visual dashboard ...
- Website metrics - Visual dashboard | Website traffic dashboard ...
- KPIs and Metrics | Sales metrics and KPIs - Visual dashboard | Meter ...
- Business Process Modeling with ConceptDraw | How To Make a ...
- UML Use Case Diagram Example Social Networking Sites Project ...
- Basic Flowchart Symbols and Meaning | Business Process ...
- Basic Flowchart Symbols and Meaning | Flow chart Example ...
- Basic Flowchart Symbols and Meaning | Design elements - Events ...
- Online store social media response flowchart | Flow chart Example ...
- Example of DFD for Online Store (Data Flow Diagram) DFD ...
- UML Deployment Diagram Example

