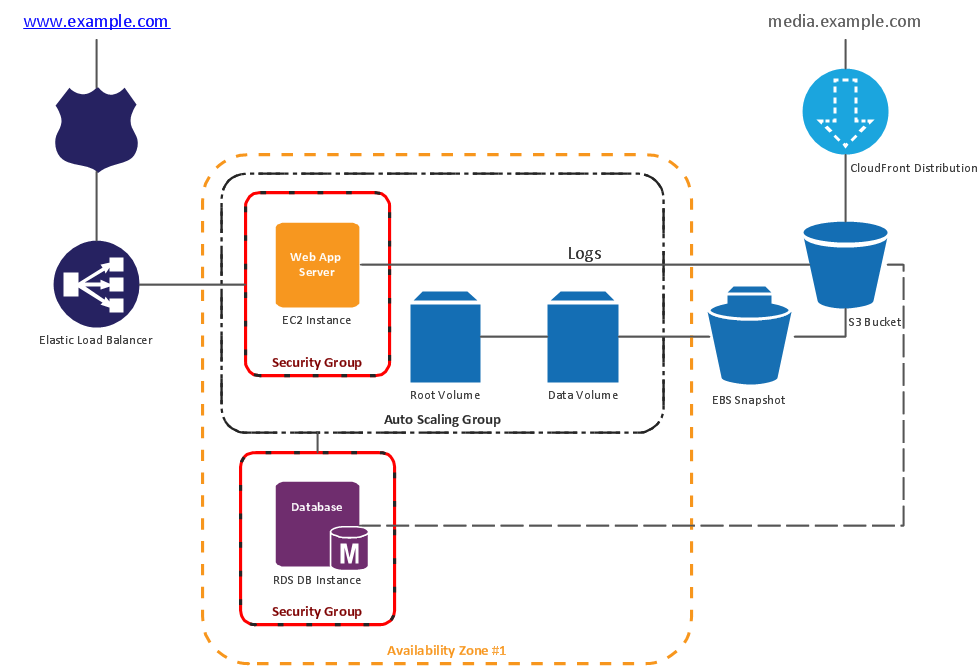
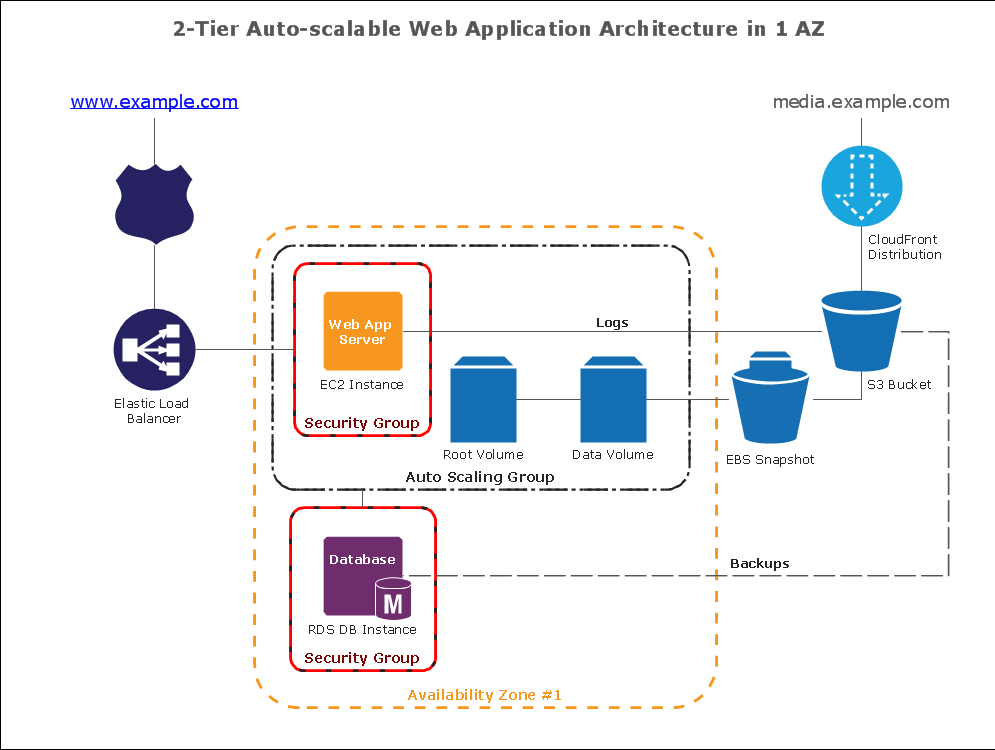
 AWS Architecture Diagrams
AWS Architecture Diagrams with powerful drawing tools and numerous predesigned Amazon icons and AWS simple icons is the best for creation the AWS Architecture Diagrams, describing the use of Amazon Web Services or Amazon Cloud Services, their application for development and implementation the systems running on the AWS infrastructure. The multifarious samples give you the good understanding of AWS platform, its structure, services, resources and features, wide opportunities, advantages and benefits from their use; solution’s templates are essential and helpful when designing, description and implementing the AWS infrastructure-based systems. Use them in technical documentation, advertising and marketing materials, in specifications, presentation slides, whitepapers, datasheets, posters, etc.
Cloud Computing Architecture Diagrams

Making Diagrams Has Never Been Easier
Entity Relationship Diagram Examples


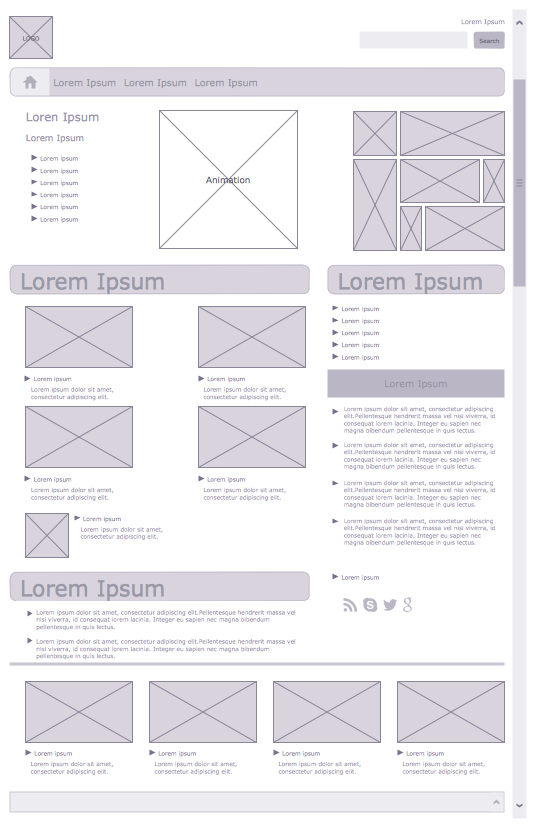
 Website Wireframe
The innovative Website Wireframe solution enhances the ConceptDraw DIAGRAM functionality with newest wireframe tools, libraries with variety of predesigned icons, symbols, buttons, graphics, forms, boxes, and many other vector elements, templates and professionally designed samples, which make it the best wireframing software. Website Wireframe solution gives you significant advantages when designing and maintaining websites, creating skeletal and content-free depictions of website structure, making website prototypes and planning the content arrangement before committing to design, also speeds up the processes of sketching, producing and sharing wireframe examples of website style and interface design.
Basic Flowchart Symbols and Meaning


How To create Diagrams for Amazon Web Services architecture
Wireframe Examples
 Business Process Diagrams
Business Process Diagrams solution extends the ConceptDraw DIAGRAM BPM software with RapidDraw interface, templates, samples and numerous libraries based on the BPMN 1.2 and BPMN 2.0 standards, which give you the possibility to visualize equally easy simple and complex processes, to design business models, to quickly develop and document in details any business processes on the stages of project’s planning and implementation.
Symboles Organigramme

- Data structure diagram with ConceptDraw PRO | Website Wireframe ...
- Data structure diagram with ConceptDraw PRO | Diagrama de ...
- A Website Structure Chart
- Website Design Structure Flow Chart
- Data structure diagram with ConceptDraw PRO | Classification Of ...
- Web Site Flow Chart
- Web Diagram For Transportation
- Web Based Information System With Diagram
- AWS Architecture Diagrams | Creando Diagramas | Server Structure ...
- Website Design Flowchart Example