 Line Graphs
How to draw a Line Graph with ease? The Line Graphs solution extends the capabilities of ConceptDraw PRO v10 with professionally designed templates, samples, and a library of vector stencils for drawing perfect Line Graphs.
Line Chart Examples
The Line Graphs solution from Graphs and Charts area of ConceptDraw Solution Park contains a set of examples, templates and design elements library of line and scatter charts. Use it to draw line and scatter graphs using ConceptDraw PRO diagramming and vector drawing software for illustrating your documents, presentations and websites.
 Picture Graphs
Typically, a Picture Graph has very broad usage. They many times used successfully in marketing, management, and manufacturing. The Picture Graphs Solution extends the capabilities of ConceptDraw PRO v10 with templates, samples, and a library of professionally developed vector stencils for designing Picture Graphs.
Line Chart Template for Word
This sample was created in ConceptDraw PRO diagramming and vector drawing software using the Line Graphs Solution from Graphs and Charts area of ConceptDraw Solution Park. This sample shows the Line Chart of annual percentage change. The Line Chart allows you to clearly see the changes of data over the time.
 Divided Bar Diagrams
The Divided Bar Diagrams Solution extends the capabilities of ConceptDraw PRO v10 with templates, samples, and a library of vector stencils for drawing high impact and professional Divided Bar Diagrams and Graphs, Bar Diagram Math, and Stacked Graph.
Bar Graph
You need to draw the Bar Graph? The automated tool can be useful for you. ConceptDraw PRO diagramming and vector drawing software extended with Bar Graphs solution from Graphs and Charts area of ConceptDraw Solution Park will help you create any Bar Graph.Chart Examples
Easy charting software comes with beautiful chart templates and examples. This makes it easy to create professional charts without prior experience.Infographic Maker
Infographic is a visual way of representing various information, data, knowledge in statistics, geography, journalism, education, and much more areas. ConceptDraw PRO supplied with Pictorial Infographics Solution from the “What are Infographics” Area, provides a set of powerful pictorial infographics tools. Thanks to them it is the best Infographic Maker.Best Diagramming Software for macOS
ConceptDraw PRO creates drawings, flowcharts, block diagrams, bar charts, histograms, pie charts, divided bar diagrams, line graphs, area charts, scatter plots, circular arrows diagrams, Venn diagrams, bubble diagrams with great visual appeal on Mac OS X.
Interactive Venn Diagram
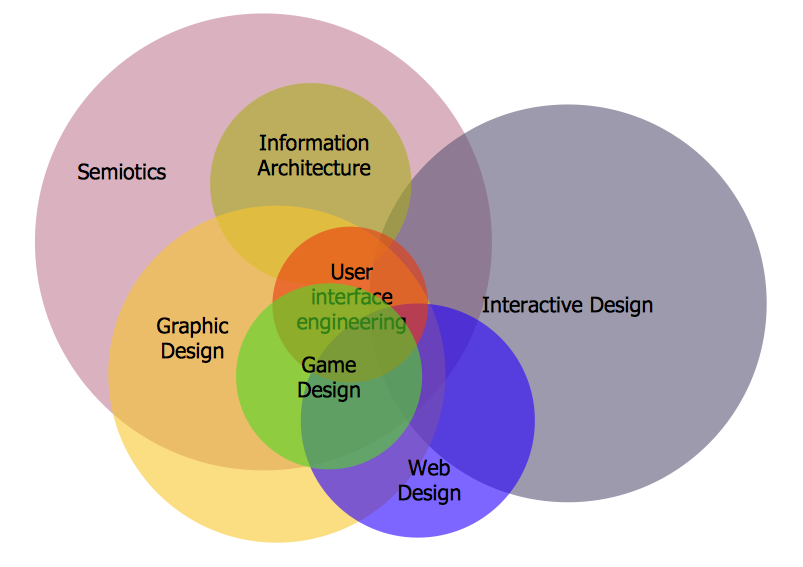
Venn Diagrams Solution offers you the Venn Diagrams library of ready-to-use vector objects and large collection of templates and samples allowing you create your own Interactive Venn Diagram in minutes. Venn Diagrams designed in ConceptDraw PRO are visual, bright, colorful, so they can be successfully used in different reports, appearances on the conferences, meetings.Sport pictograms. Olympic Games
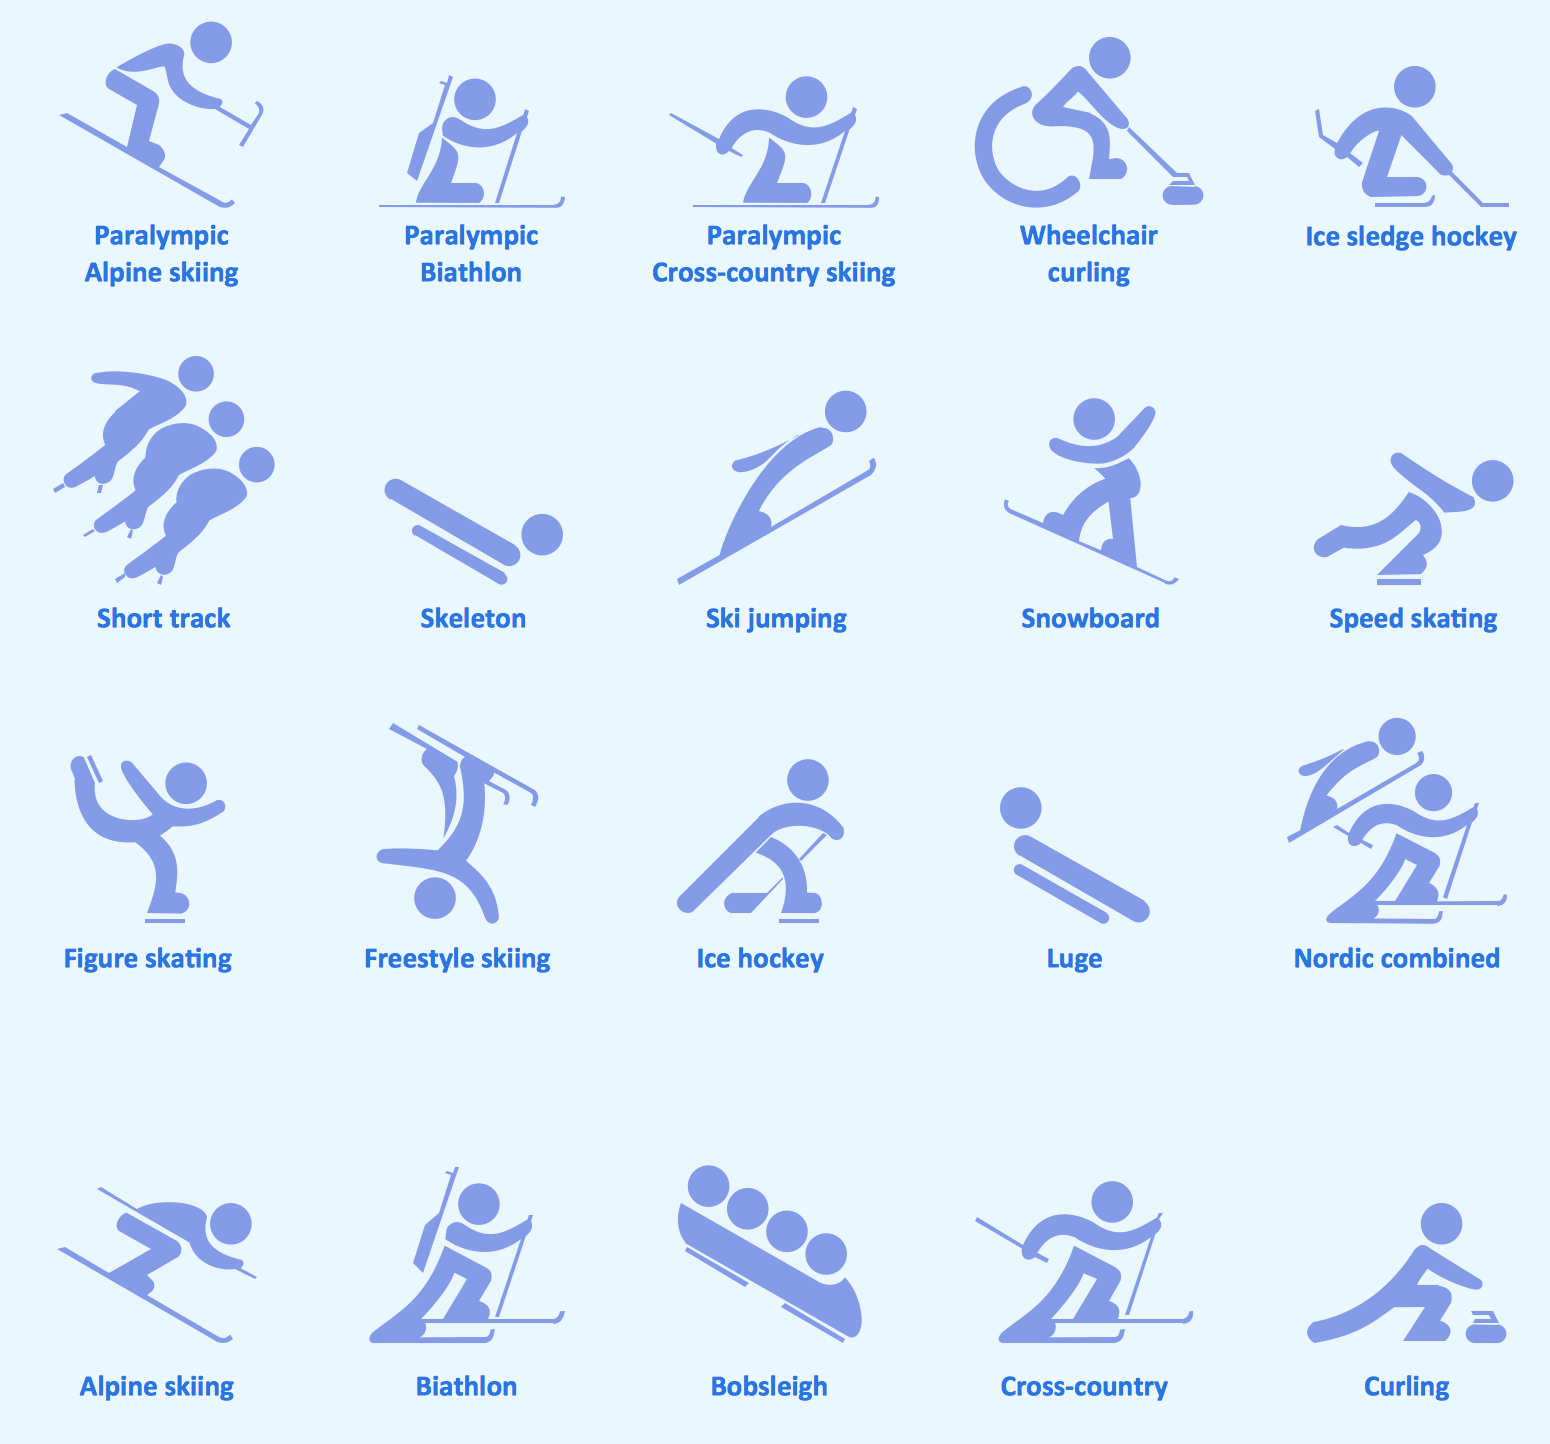
The Winter Sports solution from Sport Area of ConceptDraw Solution Park contains winter sports pictograms you may use illustrating any kind of material about Olympic Games or any other sport competitions.
 Bar Graphs
The Bar Graphs solution enhances ConceptDraw PRO v10 functionality with templates, numerous professional-looking samples, and a library of vector stencils for drawing different types of Bar Graphs, such as Simple Bar Graph, Double Bar Graph, Divided Bar Graph, Horizontal Bar Graph, Vertical Bar Graph, and Column Bar Chart.
Network Visualization with ConceptDraw PRO
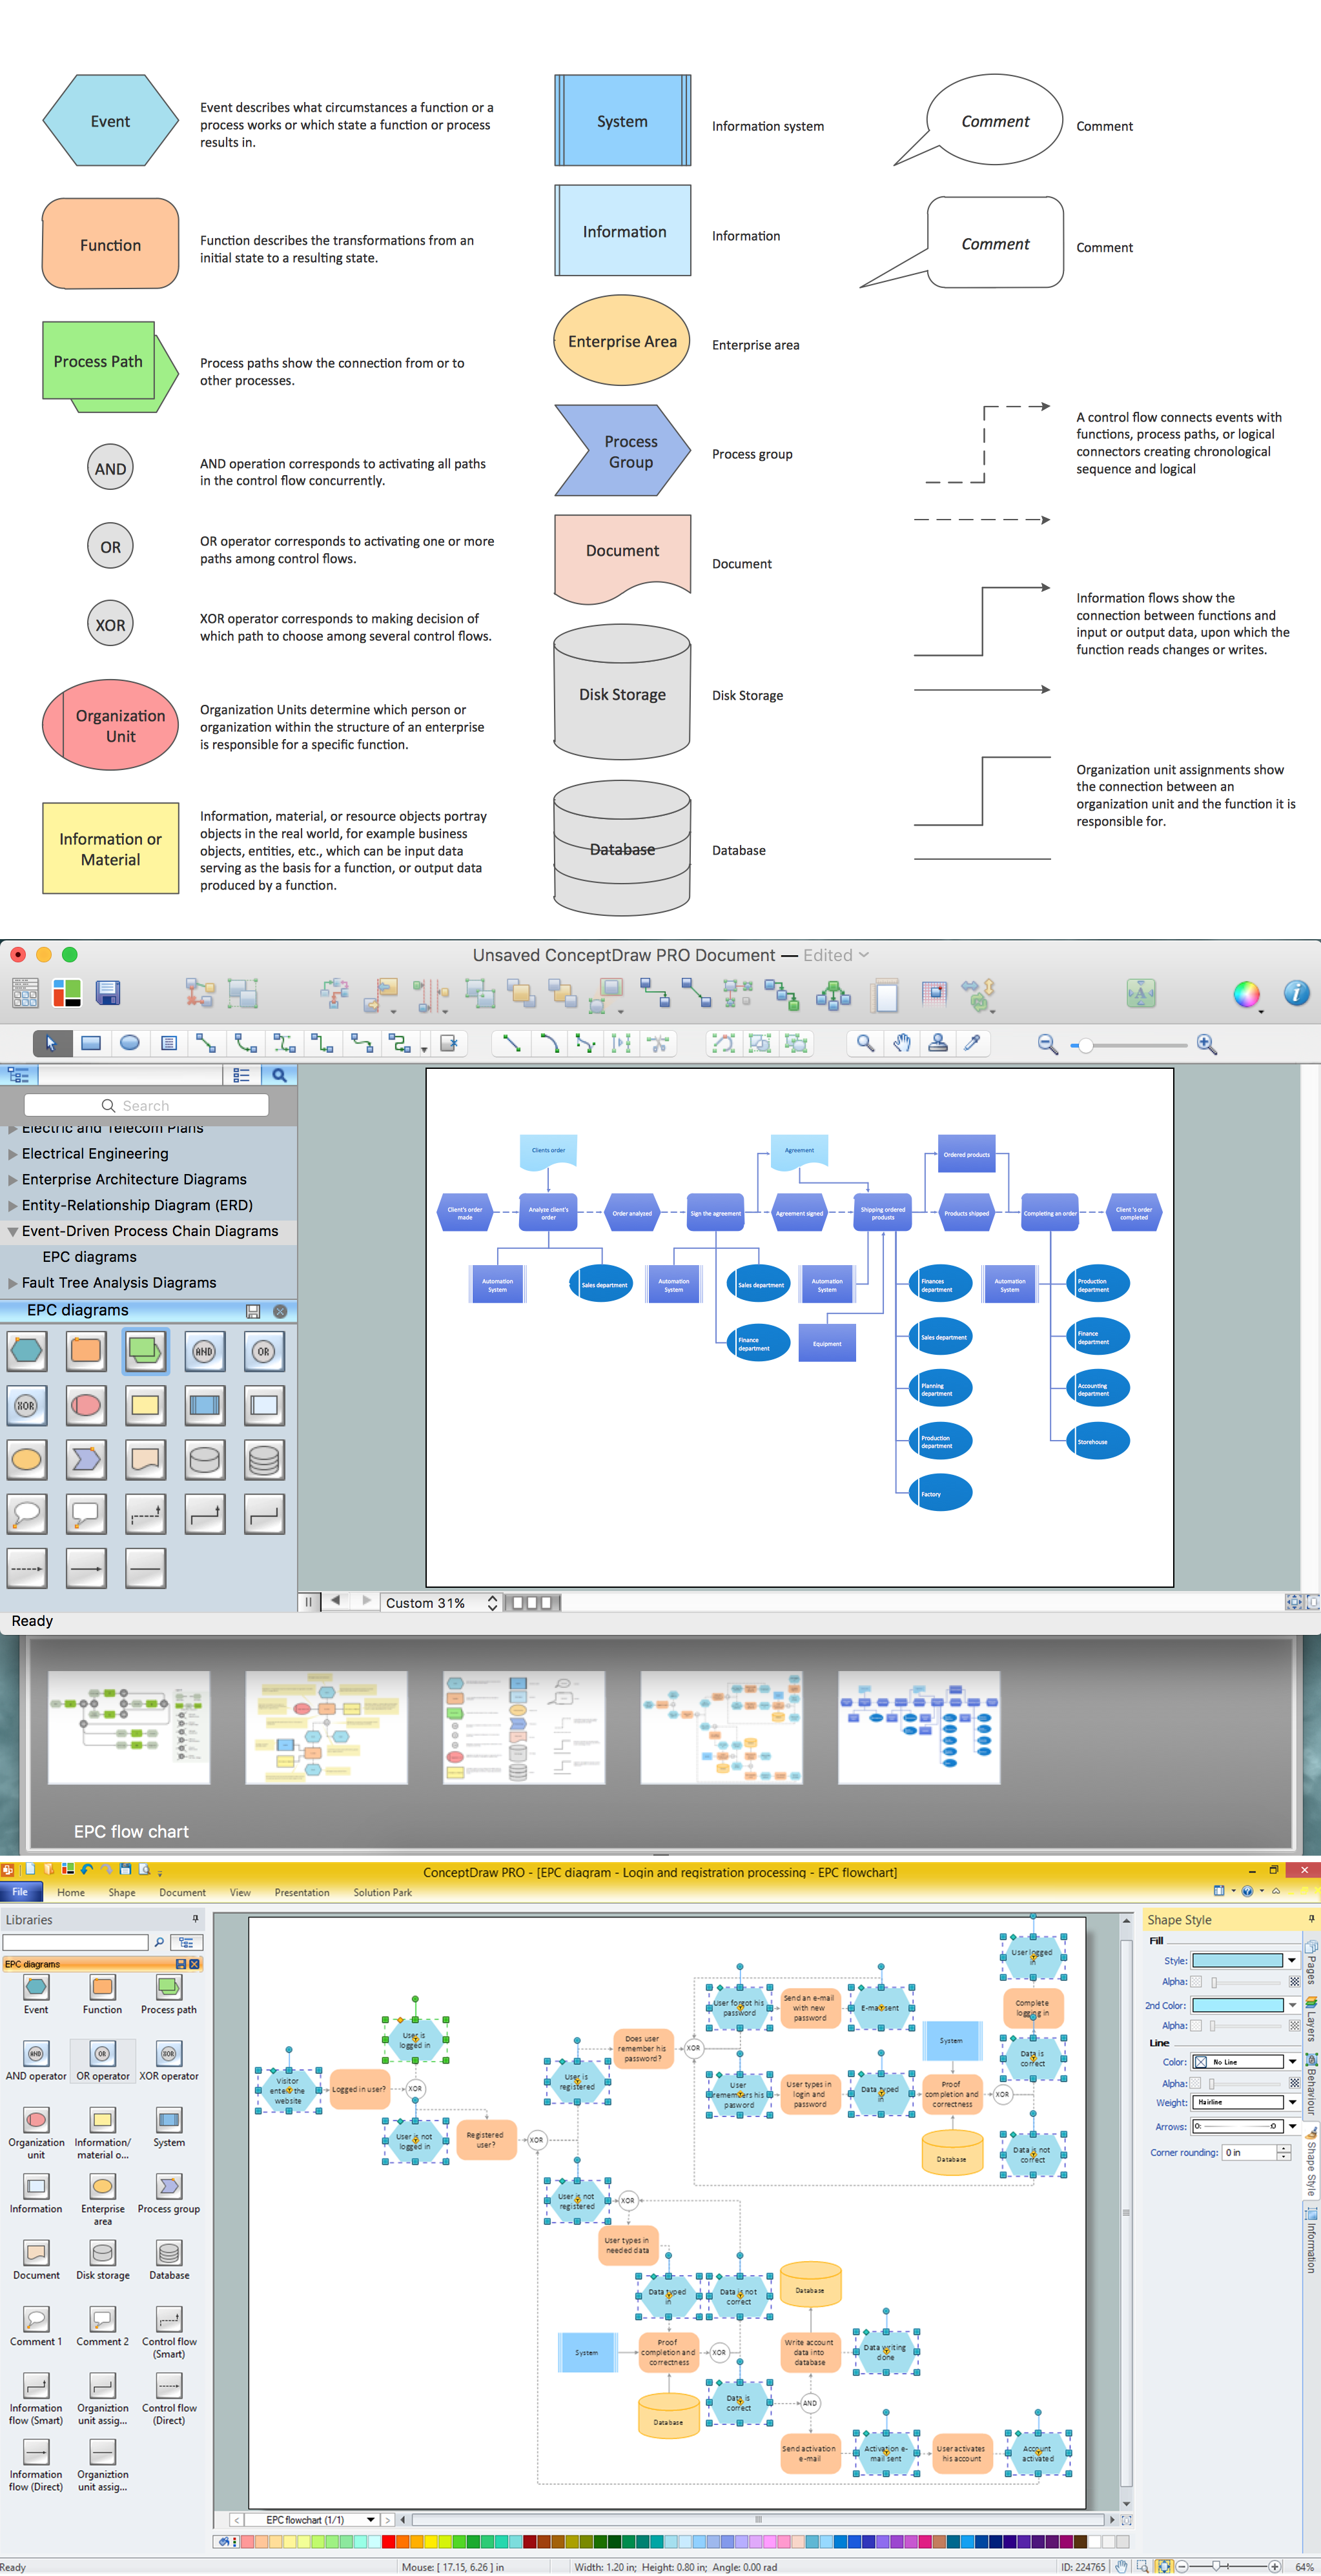
ConceptDraw makes the entire process of network visualization easier thanks to the numerous ready-to-use objects included in the package for presentation of network equipment, LDAP directory symbols and many other objects that symbolize resources in most various representations.Business process Flow Chart - Event-Driven Process chain (EPC) diagrams
Event-Driven Process chain Diagrams for improvement throughout an organisation. Best software for Process Flow Diagram. The Event-driven Process Chain (EPC) Diagrams allows managers to plan processes and resources.Venn Diagram Examples for Problem Solving. Computer Science. Chomsky Hierarchy
A Venn diagram, sometimes referred to as a set diagram, is a diagramming style used to show all the possible logical relations between a finite amount of sets. In mathematical terms, a set is a collection of distinct objects gathered together into a group, which can then itself be termed as a single object. Venn diagrams represent these objects on a page as circles or ellipses, and their placement in relation to each other describes the relationships between them. The Venn diagram example below visualizes the the class of language inclusions described by the Chomsky hierarchy.- Maths Pie Chart Design Image
- Business Statistics Diagram
- Sales Growth. Bar Graphs Example | Bar Chart Examples | Bar ...
- Line Chart Examples | How to Create a Line Chart | Line Chart ...
- Examples Of Line Graph Templates
- Line Graph Chart Templates
- Scatter Graph Charting Software | Scatter graphs - Vector stencils ...
- An Example Of Lines As A Graphing Designing Element
- Picture Graphs | Bar Diagram Math | Chart Examples | Examples Of ...
- Scatter Plot | Blank Scatter Plot | Design elements - Scatterplot ...
- Pie Chart Software | Pie Chart Examples and Templates ...
- Create Circle Graph Template
- What Is Your Design Category You Are Looking For
- Picture graph - Template | Picture Graphs | Picture graph - Template ...
- Scatter Chart Examples | Line Chart Examples | Scatter Diagrams ...
- Pictures of Graphs | What Is a Picture Graph ? | Basic Diagramming ...
- Business Report Pie. Pie Chart Examples | Design elements - Sales ...
- Percentage Graph Design
- Economic Graphs
- How to Draw a Divided Bar Chart in ConceptDraw PRO | Divided ...


