Chart Examples

This example visual dashboard example shows website traffic metrics. Divided bar chart and pie chart are used to visualize compositional data. Scatter plot is used to visually analyse correlation between two data sets.
"Web traffic is the amount of data sent and received by visitors to a web site. ...
This is determined by the number of visitors and the number of pages they visit. Sites monitor the incoming and outgoing traffic to see which parts or pages of their site are popular and if there are any apparent trends, such as one specific page being viewed mostly by people in a particular country. There are many ways to monitor this traffic and the gathered data is used to help structure sites, highlight security problems or indicate a potential lack of bandwidth not all web traffic is welcome. Some companies offer advertising schemes that, in return for increased web traffic (visitors), pay for screen space on the site. Sites also often aim to increase their web traffic through inclusion on search engines and through search engine optimization." [Web traffic. Wikipedia]
The example "Website traffic dashboard" was created using the ConceptDraw PRO diagramming and vector drawing software extended with the Corellation Dashboard solution from the area "What is a Dashboard" of ConceptDraw Solution Park.
Visual dashboard

Chart Templates

Chart Software for Better Presentations

Pyramid Diagram and Pyramid Chart

Scatter Chart Examples

Example Process Flow

Wireframe Examples
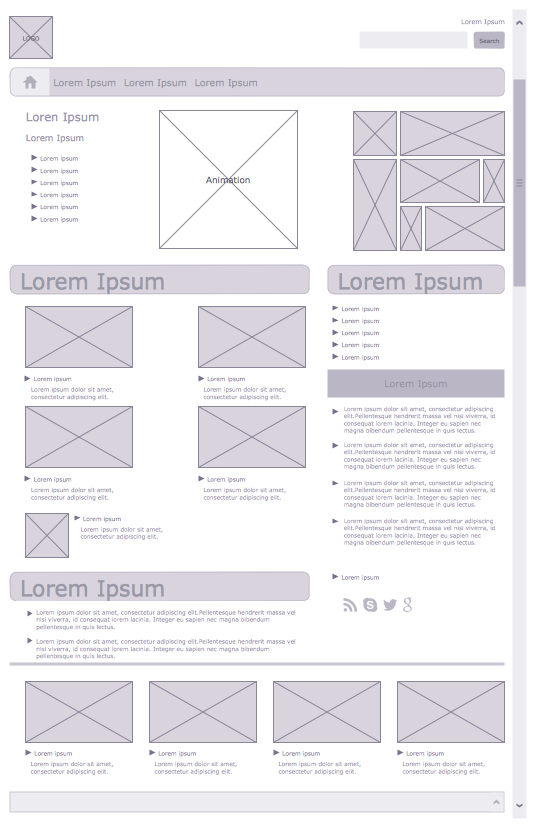
 Website Wireframe
The innovative Website Wireframe solution enhances the ConceptDraw DIAGRAM functionality with newest wireframe tools, libraries with variety of predesigned icons, symbols, buttons, graphics, forms, boxes, and many other vector elements, templates and professionally designed samples, which make it the best wireframing software. Website Wireframe solution gives you significant advantages when designing and maintaining websites, creating skeletal and content-free depictions of website structure, making website prototypes and planning the content arrangement before committing to design, also speeds up the processes of sketching, producing and sharing wireframe examples of website style and interface design.
Basic Diagramming Flowchart Software

Best Program to Create a Fowchart

Flowchart

- Website Design Flowchart Example
- Line Chart Examples | Chart Examples | Picture Graph | Graph ...
- Pyramid Diagram and Pyramid Chart | Ponzi Scheme Website ...
- Website Organization Chart
- Android Websites Making Flow Chart
- Website launch - Flowchart
- Website Flowchart Tools For Web Design
- Website Flowchart Example
- Flow Chart Of Websites
- Flow chart Example. Warehouse Flowchart | Accounting Flowcharts ...
- Basic Flowchart Symbols and Meaning | Flowchart | Website launch ...
- Pyramid Diagram and Pyramid Chart | Pyramid Charts | Microsoft ...
- Website launch - Flowchart | Website Wireframe | Website traffic ...
- Website launch - Flowchart | Basic Flowchart Symbols and Meaning ...
- Website metrics - Visual dashboard | Construction Project Chart ...
- Flowchart For Social Networking Website Project
- Website Process Flow Chart
- Website Launch Flow Chart
- Status Dashboard | Composition Dashboard | Website Wireframe ...
- Flowchart Examples Website Development Project