Matrices
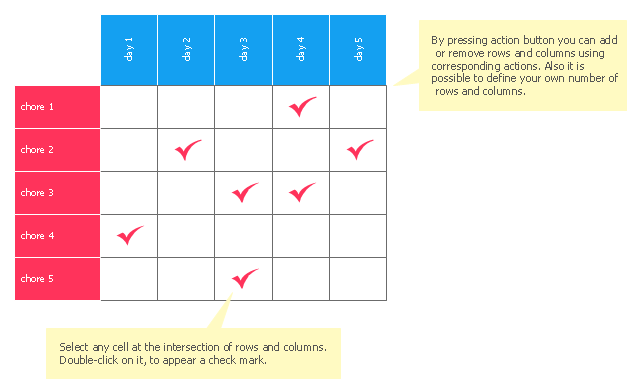
ConceptDraw DIAGRAM extended with Matrices Solution from the Marketing Area of ConceptDraw Solution Park is a powerful software for drawing various types of Marketing Matrices: Ansoff Matrix, BCG Matrix, Deployment Chart, Feature Comparison Chart, Competitive Strategies Matrix, Flow Process Chart, Porter's Value Chain Diagram, Positioning Map, and many others.Chore charts with ConceptDraw DIAGRAM
Chore chart. Draw perfect-looking chore chart. Free chore chart samples. All about chore charts.How can you illustrate the weather condition
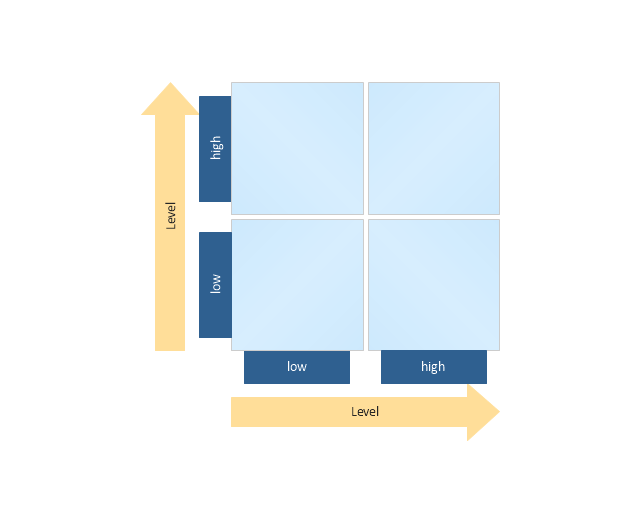
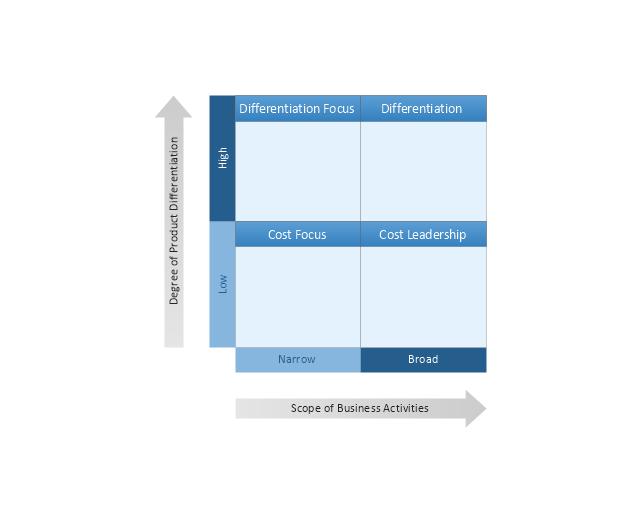
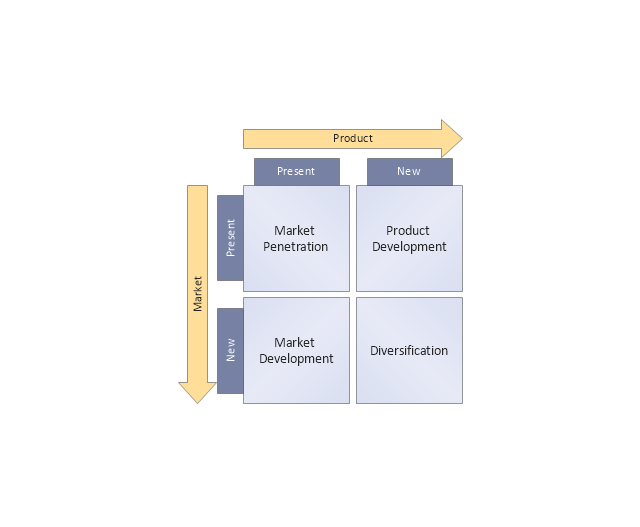
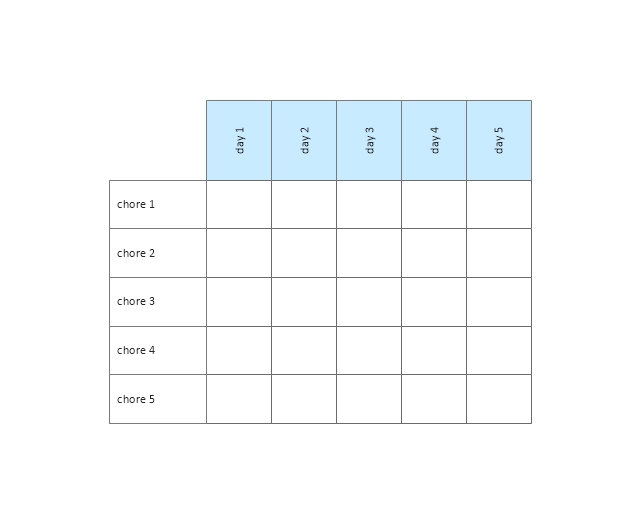
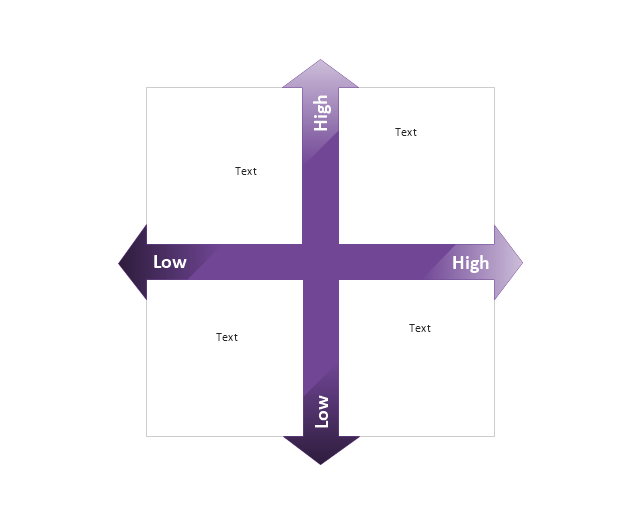
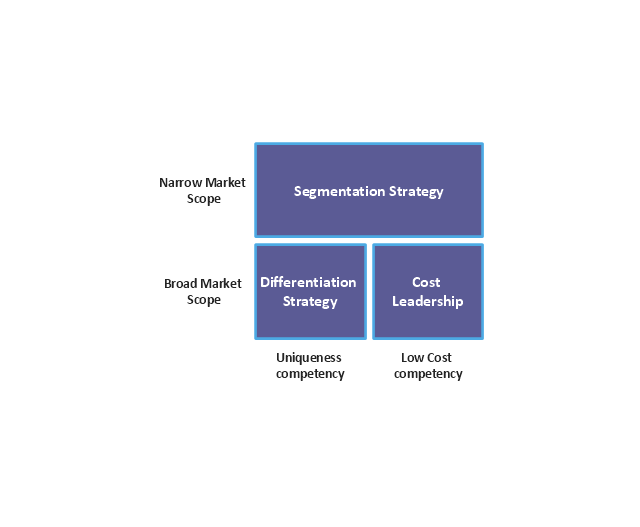
Use it to make professional looking documents, presentations, and websites illustrated with color scalable vector clipart for geography, weather, and animals.The vector stencils library "Matrices" contains 10 templates of marketing matrix diagrams and charts.
Use these templates to create your marketing matrices in the ConceptDraw PRO diagramming and vector drawing software extended with the Matrices solution from the Marketing area of ConceptDraw Solution Park.
Use these templates to create your marketing matrices in the ConceptDraw PRO diagramming and vector drawing software extended with the Matrices solution from the Marketing area of ConceptDraw Solution Park.
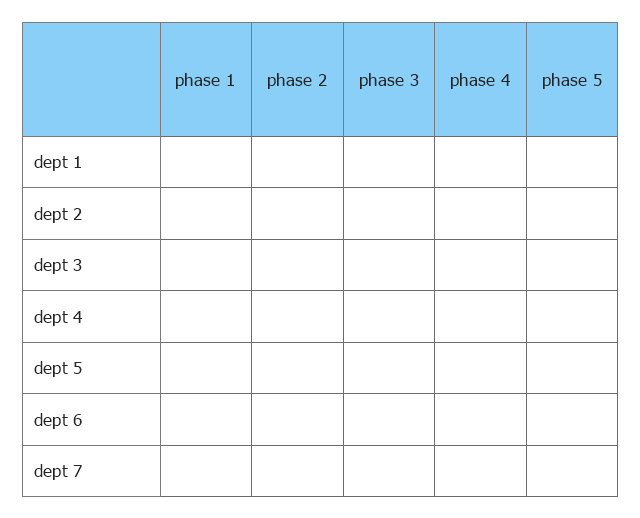
Deployment Chart Software
ConceptDraw DIAGRAM extended with Matrices solution from the Marketing area of ConceptDraw Solution Park is the best Deployment Chart Software. The Matrices solution offers you the useful tools for creating Deployment Charts in just minutes. The Deployment Charts designed with ConceptDraw DIAGRAM are vector graphic documents and are available for reviewing, modifying, converting to a variety of formats (image, HTML, PDF file, MS PowerPoint Presentation, Adobe Flash or MS Visio XML), printing and send via e-mail in one moment.Business and Finance Illustrations Example
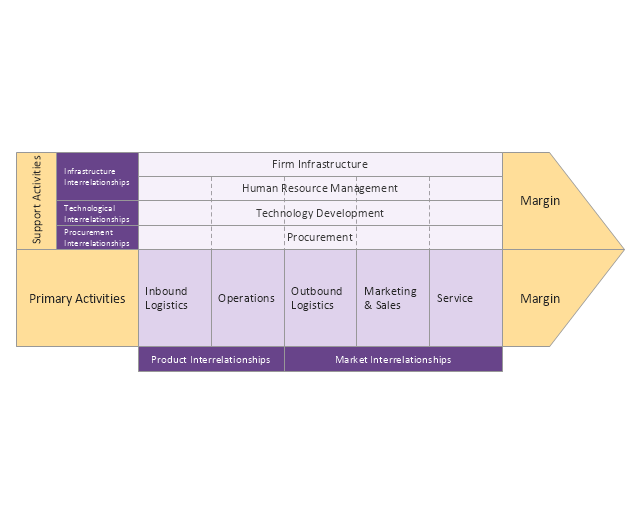
ConceptDraw Business Finance Illustration examples and libraries contain vector clip art for drawing different Business and Finance Illustrations. You may find Advertising example, Project Management example, Business Model example and many more.Porter's Value Chain
ConceptDraw DIAGRAM diagramming and vector drawing software offers you the Matrices Solution from the Marketing Area with extensive drawing tools for creating the Porter's Value Chain diagrams.Building Drawing. Design Element Site Plan
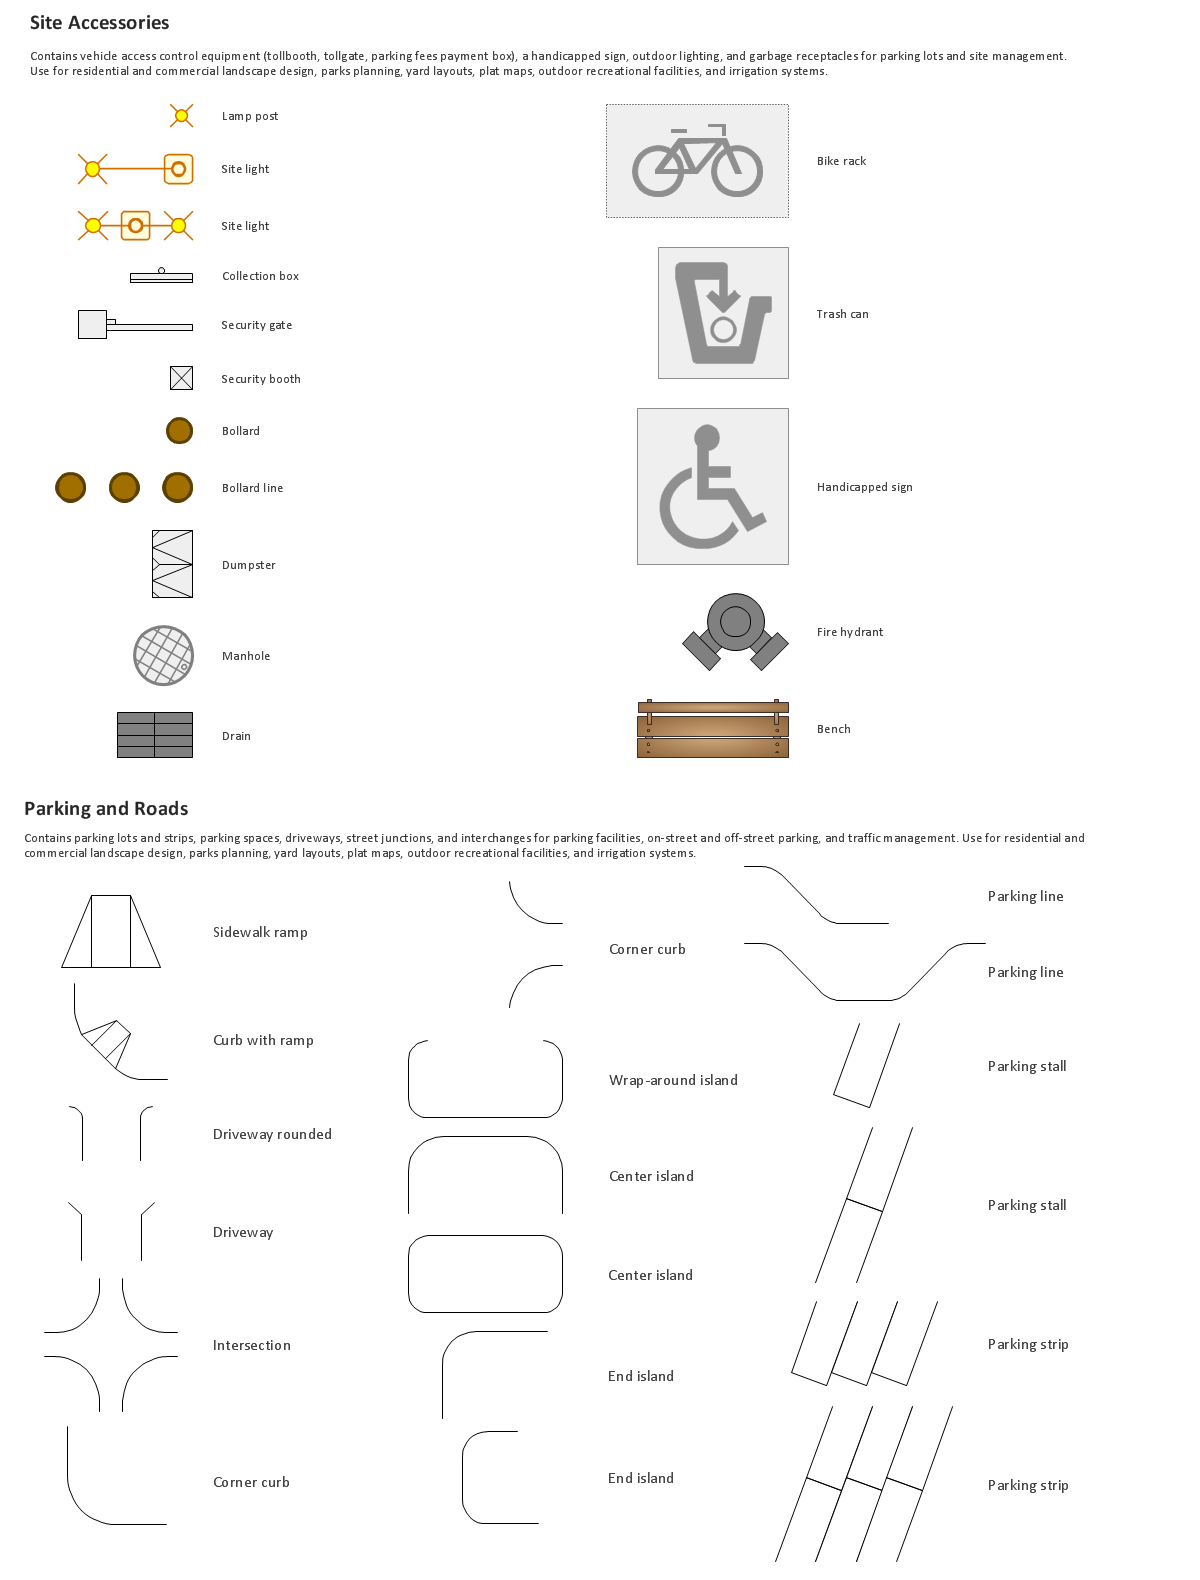
Site Plan is a part of a development project. It is a visual graphic representation of the arrangement of buildings, parking for cars and bikes, drives, landscaping, parks, flowerbeds, benches and other structural elements on the plan. Depending on the degree of detailing you can see on the Site plan more or fewer of building constructions and landscape design elements. ConceptDraw DIAGRAM Solution Park includes a specially developed Site Plans solution from the Building Plans area, which offers templates, samples, examples, and a lot of predesigned building drawing design elements for Site plan. The set of design elements contains the exclusive vector shapes of site accessories, parking, roads, trees, plants, etc. So, with confidence we can say that ConceptDraw DIAGRAM software with Site Plans solution is the best help for all in development and drawing your own Residential and Commercial landscape designs, Site plans, Park plans, Yard layouts, Outdoor recreational facilities and Irrigation system plans, and many others.
What is Gantt Chart (historical reference)
Historical reference about the Gantt chart.Pictures of Vegetables
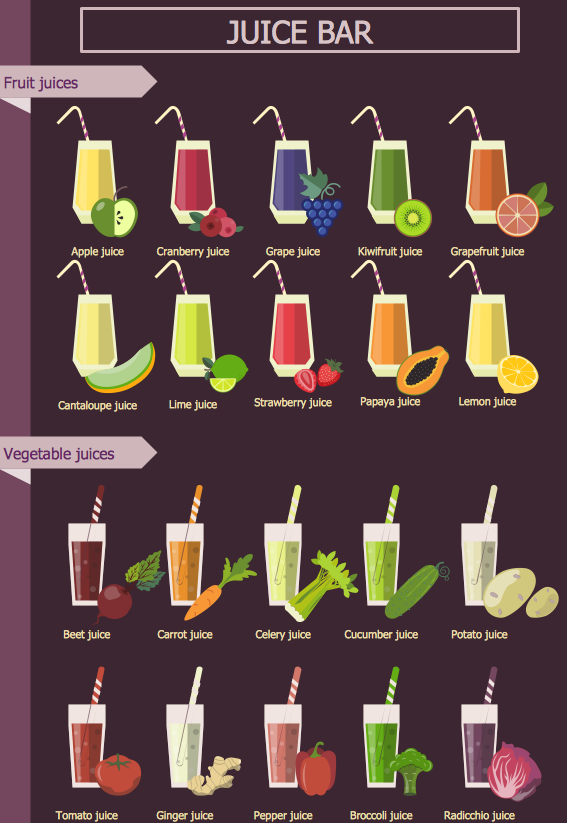
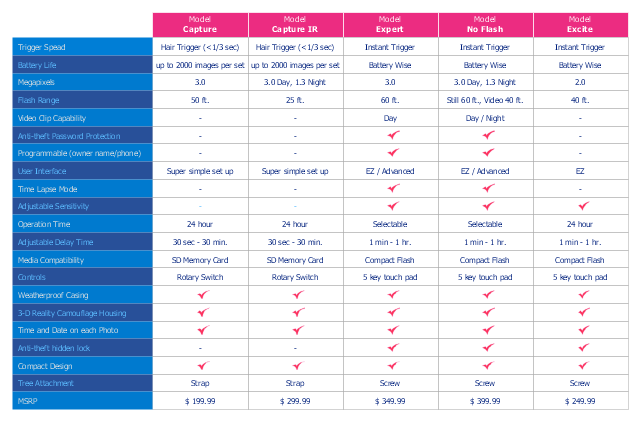
Designing of food images, fruit art illustrations, pictures of vegetables, and many other food and cafe related images and infographics has never been easier than it is now with ConceptDraw DIAGRAM software. ConceptDraw DIAGRAM diagramming and vector drawing software extended with Food Court solution from the Food and Beverage area of ConceptDraw Solution Park is perfect food pictures design software.Competitive Feature Comparison Matrix is a tool to compare the features and functionality of competitive products or services in side-by-side table.
The feature comparison matrices are used for feature comparison analysis of competitive products and services.
This competitive feature comparison matrix chart example was created using the ConceptDraw PRO diagramming and vector drawing software extended with the Matrices solution from the Marketing area of ConceptDraw Solution Park.
Easy Recipes
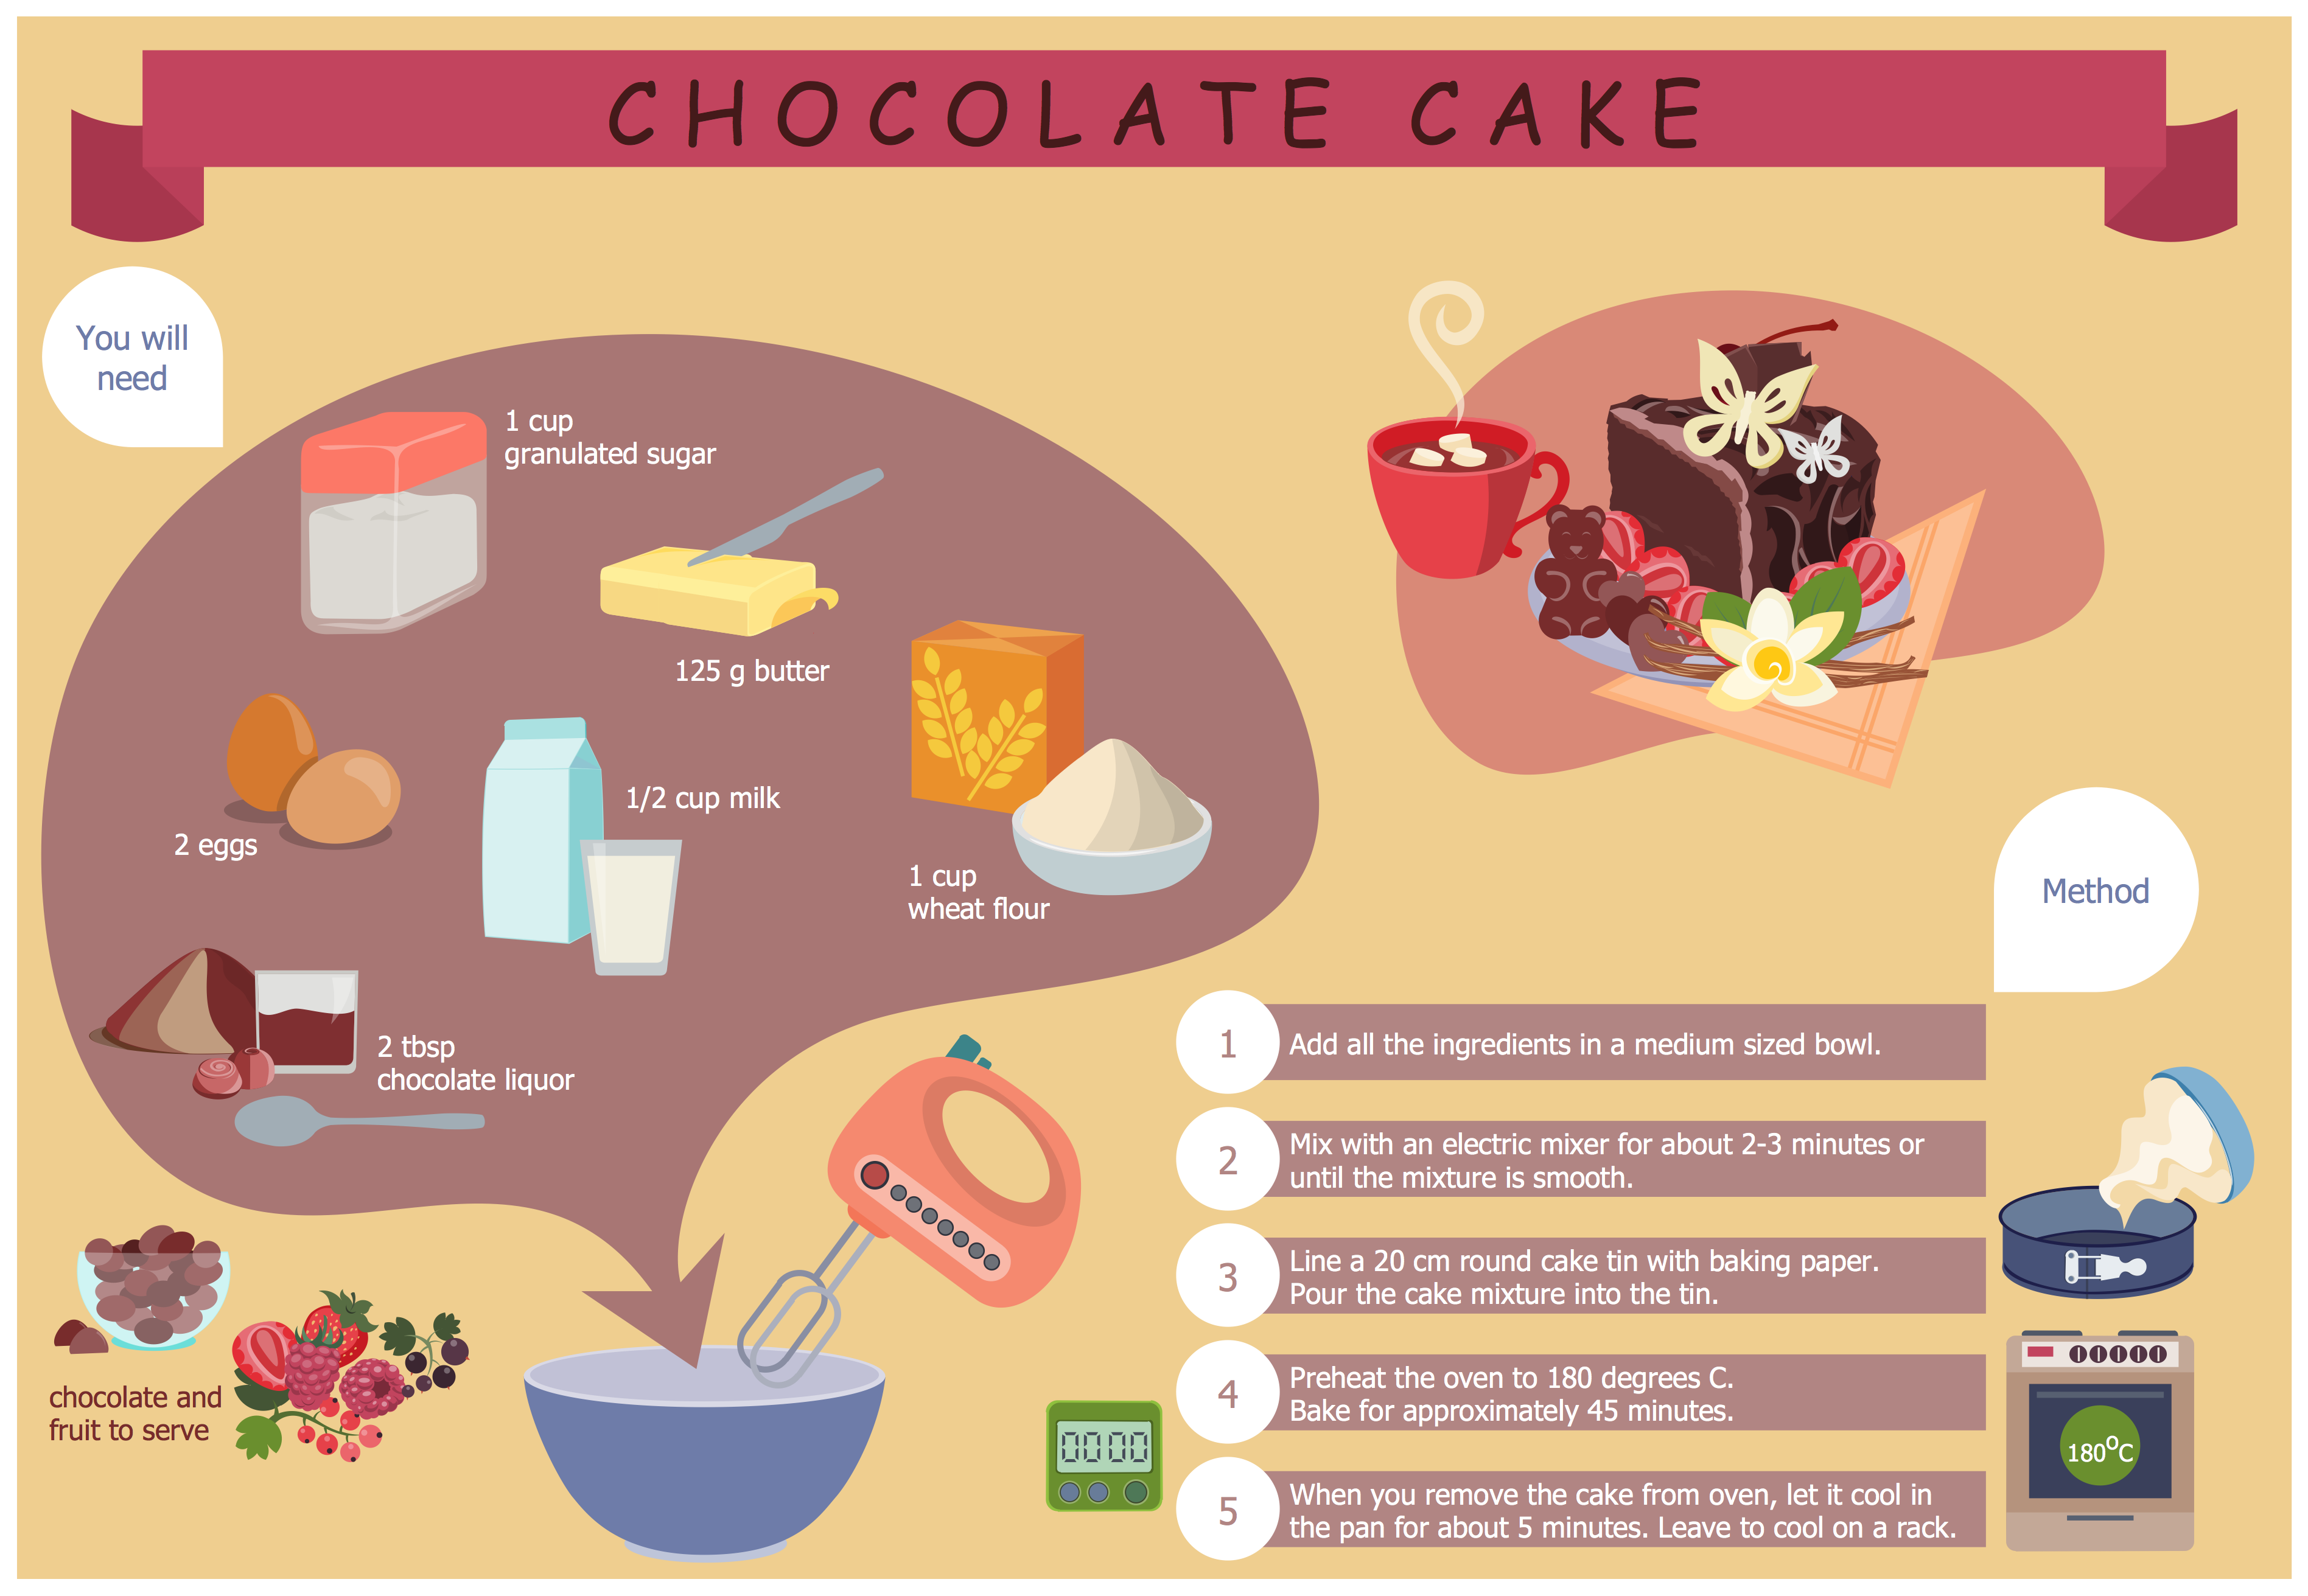
You want to decorate menu, design pictorial illustration for the cooking article in the fashionable magazine, create attractive posters for your cafe or restaurant, or develop beautiful advertising materials? In order to ideally cope with all these tasks, use the easy recipes design software - ConceptDraw DIAGRAM extended with Cooking Recipes solution from the Food and Beverage area of ConceptDraw Solution Park.Remote Projects in Corporate Strategy
Communication is the main challenge and the key success factor for organizational project management in company with remote projects. Communicating visually via Skype you bring all projects together to achieve corporate goals.
Corrective Action Planning
One of the stages of the problem's solving process scenario is Corrective Action Planning. Corrective action planning define people and groups involvement in corrective actions by roles, identify logical sequences of scheduled actions and critical path of problem solving, identify possible risks of action plan and propose preventive actions.
Integration Definition
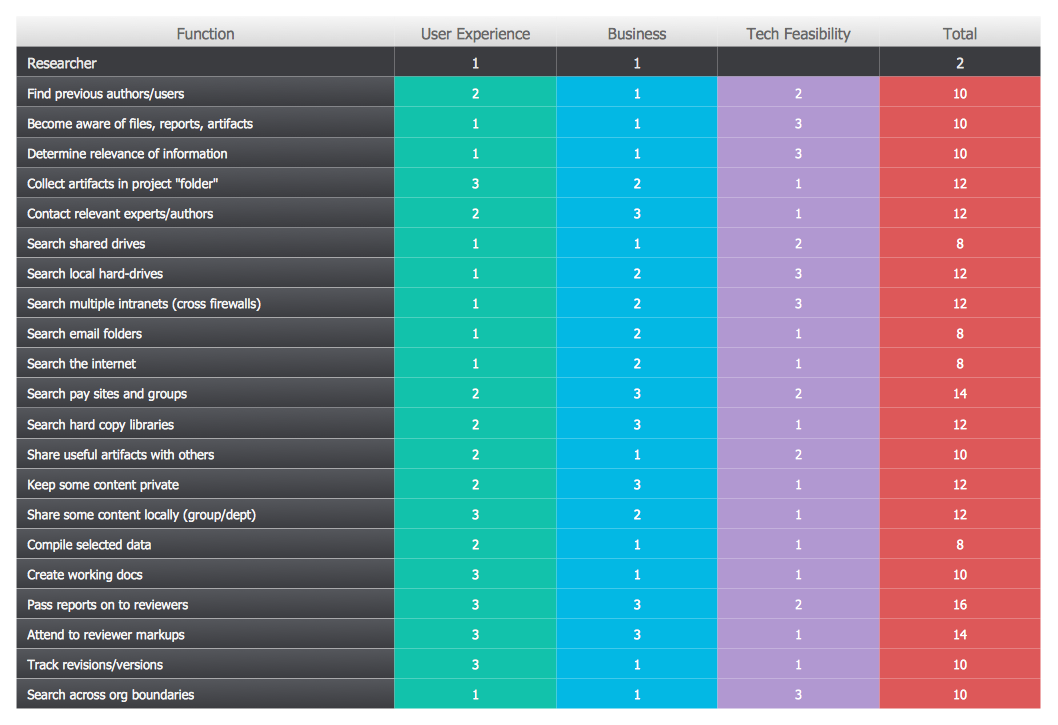
Creation of various types of Integration DEFinition (IDEF) diagrams - IDEF0, IDEF1X, IDEF2, IDEF3 and many other is a sufficiently complex process that requires powerful automated tools. ConceptDraw DIAGRAM diagramming and vector drawing software offers you such tool - IDEF Business Process Diagrams solution from the Business Processes area of ConceptDraw Solution Park.Prioritization Matrix
You can design the Prioritization Matrix by hand on the paper, but we offer you the most easier way - to use the ConceptDraw DIAGRAM diagramming and vector drawing software extended with Seven Management and Planning Tools Solution from the Management Area.BCG Matrix
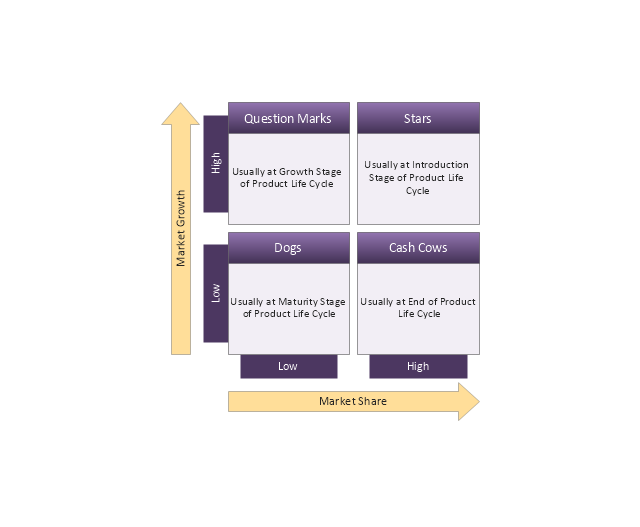
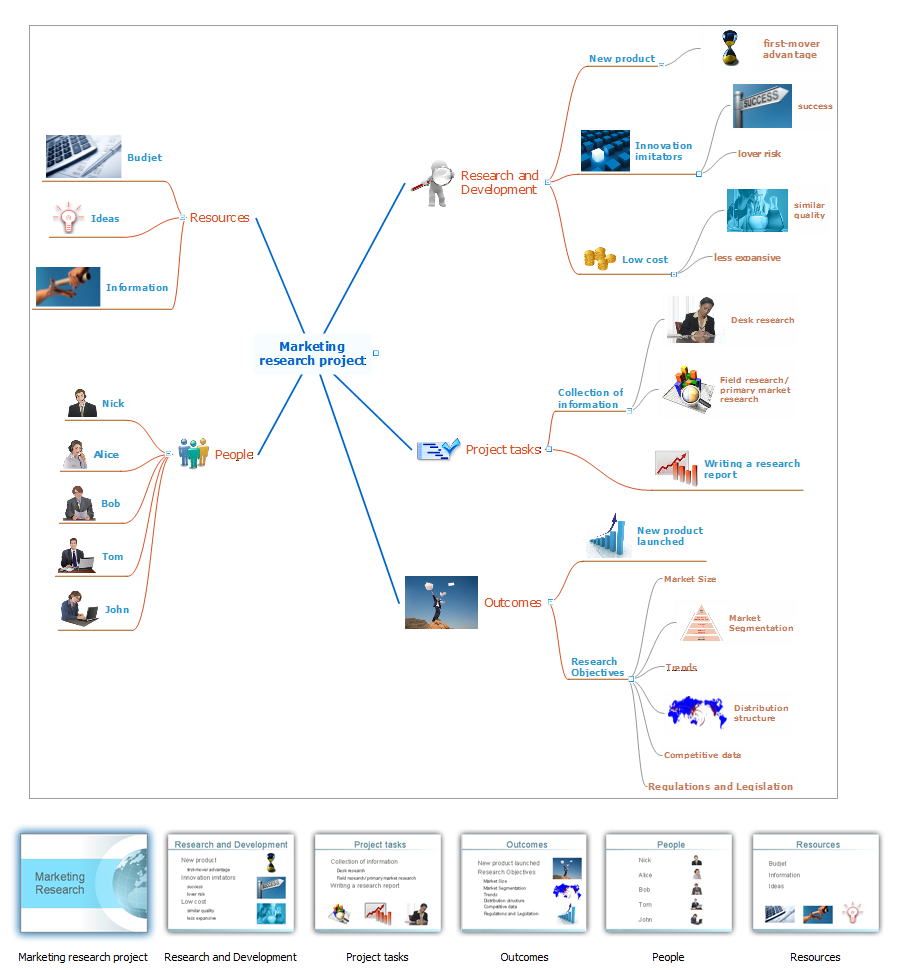
The growth–share matrix (BCG Matrix) was created by Bruce D. Henderson for the Boston Consulting Group in 1970 to help corporations to analyze their business units and to help the company allocate resources. How is it easy design the BCG Matrices in ConceptDraw DIAGRAM diagramming and vector drawing software supplied with unique Matrices Solution from the Marketing Area of ConceptDraw Solution Park.Creating a default presentation in ConceptDraw MINDMAP
ConceptDraw MINDMAP a versatile, yet easy-to-use tool for organizing ideas and data. Creates mind maps that intuitively illustrate your thought process. Outputs a wide variety of document styles and formats. Delivers presentations from mind maps with built-in modes and MS PowerPoint export. Perfect for brainstorming, project planning, meeting management, note taking, and more.- Chore chart - Template | Deployment chart - Template | Matrices ...
- Chore chart - Template | Household Moving Checklist | Matrices ...
- Chore charts with ConceptDraw PRO | Chore chart - Template ...
- Chore charts with ConceptDraw DIAGRAM | Chore chart - Template ...
- Linear Responsibility Chart Template
- Chore chart - Template
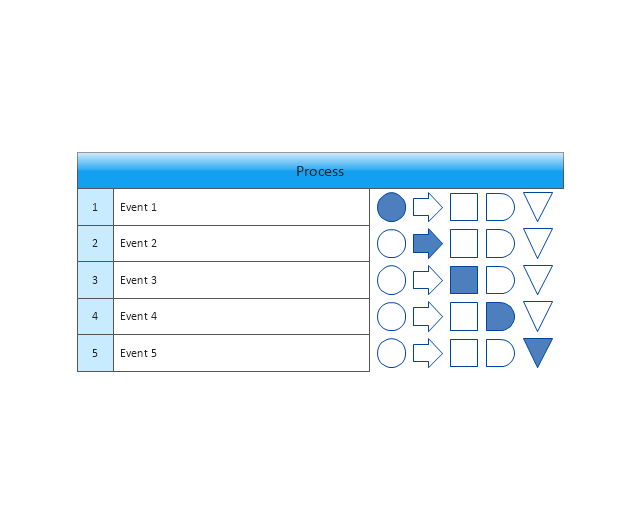
- Process Flow Analysis Diagram Examples Household Chores
- Chore charts with ConceptDraw DIAGRAM | Household Moving ...
- Deployment chart - Template
- Chore charts with ConceptDraw DIAGRAM | Draw Diagram on Mac ...
- Organizational Chart Templates | Bar Chart Template for Word | Pie ...
- Chore charts with ConceptDraw PRO | Army Flow Charts | Examples ...
- Marketing | Sector diagram - Template | Matrices | Feature ...
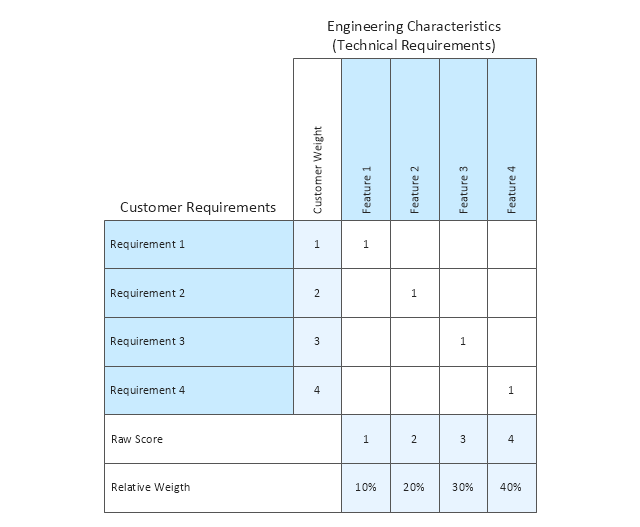
- QFD matrix - Template | QFD diagram - Template | Quality function ...
- New Year card House covered with snow - Template | Software ...
- Responsibility assignment matrix - Central statistical office | Person ...
- What is Gantt Chart (historical reference) | Critical Path Method in ...
- Sample Bubble Diagram For G 1 Residential Building
- Deployment Chart Software | Deployment chart - Template | UML ...
