What Is a Circle Spoke Diagram
What Is a Circle Spoke Diagram? It is a diagram which have a central item surrounded by other items in a circle. The Circle Spoke Diagrams are often used to show the features or components of the central item in marketing and management documents and presentations. ConceptDraw PRO extended with Circle-Spoke Diagrams Solution from the "What is a Diagram" Area is the best software for creating Circle-Spoke Diagrams.What is Entity-Relationship Diagram
Entity Relationship Diagram (ERD) is an acknowledged method to visualize the logical structure of databases. Using special symbols described in ERD notations you can depict a database of any complexity. The vector graphic ER diagrams produced when using ConceptDraw ERD solution can be used in whitepapers, presentations, datasheets, posters, or any technical materials.What Constitutes a Project?
Separated into categories of Basic, Intermediate, and Advanced categories, the new instructional videos about ConceptDraw PROJECT cover a huge breadth of topics, explaining how to use project management software. Users new to ConceptDraw PROJECT will find the Basic lessons an essential platform for familiarizing themselves with the programs′s functions and found it simple project management software. This video lesson is the first in Basic lessons series tells about affordable simple project management software, it may be used as an intro for what is project management using simple project management sample. ConceptDraw PROJECT is excellent portfolio project management software, this lessons explains how to use project management software for small business in case of multi project environment.
Flowchart. What is Flowchart
The Flowcharts have one or more starting and ending points. The geometric figures on the Flowcharts represent the steps of the process and are connected with arrows that show the sequence of the actions. The Flowcharts can be orientated vertically or horizontally. ConceptDraw PRO is a powerful software for creating professional looking Flowcharts quick and easy. For this purpose you can use the Flowcharts solution from the What is a Diagram area of ConceptDraw Solution Park.What Is a Concept Map
What is a Concept Map and what software is effective for its design? A concept map or conceptual diagram is a diagram that depicts suggested relationships between concepts. As for effective software - we suggest you to pay attention for the ConceptDraw PRO diagramming and vector drawing software. Extended with Concept Maps Solution from the "What is a Diagram" Area it is a real godsend for you.What is the Accounting Cycle?
What is the accounting cycle? The accounting cycle is a sequence of steps that occur in the accounting period and include the processes of identifying, collecting, analyzing documents, recording transactions, classifying, summarizing, and reporting financial information of an organization.What Is a Wireless Network?
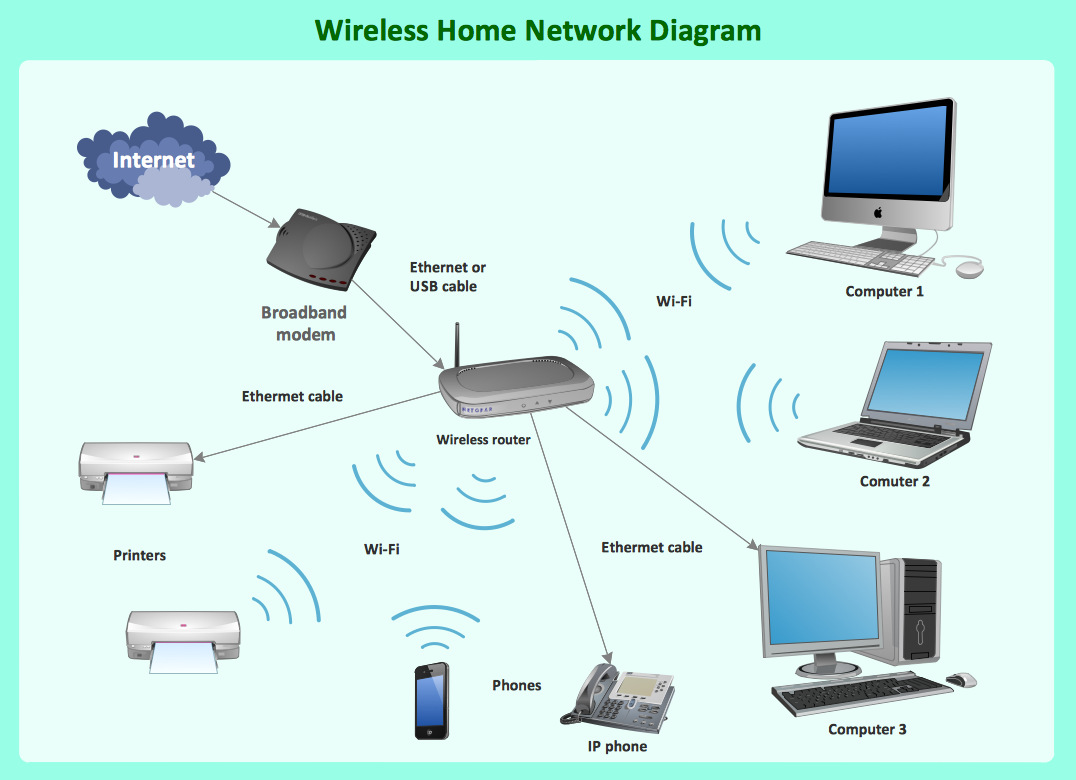
What Is a Wireless Network? Wireless network refers to any type of computer network that uses wireless (usually, but not always radio waves) for network connections. Wireless computer network diagrams help system administrators and network engineers to find out amount and type of equipment needed for each office WLAN.What is IVR?
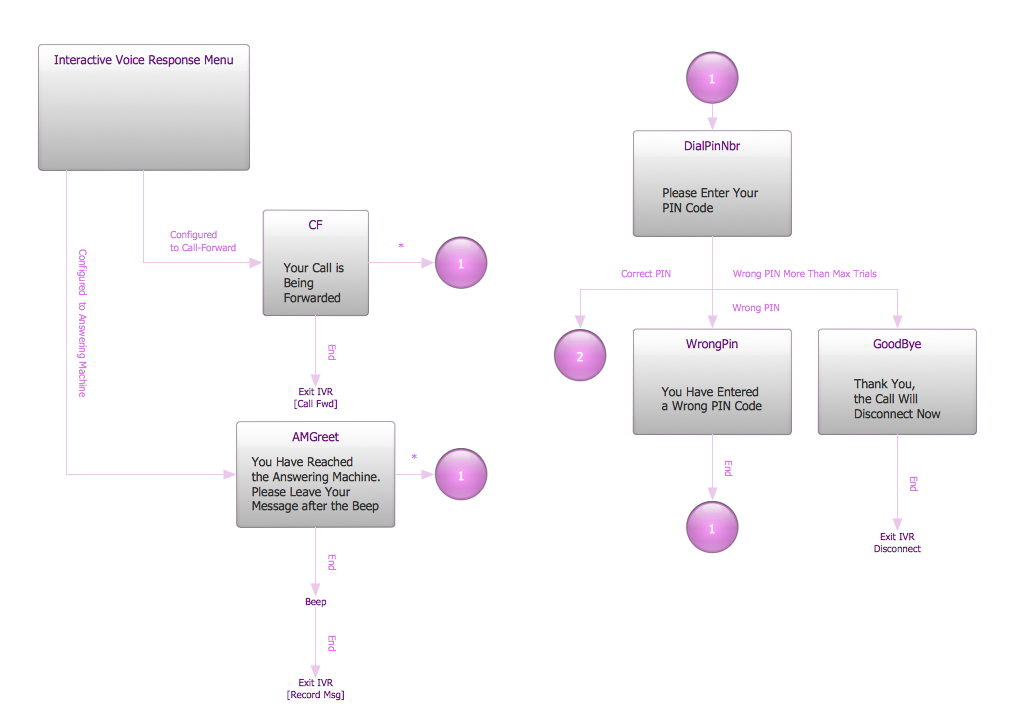
What is IVR? The Interactive voice response (IVR) is a popular and widely used technology which allows a computer to detect voice and keypad inputs, so it makes possible the interactions between computer and humans through the use of voice and dual-tone multi-frequency (DTMF) signals. For illustrating the logical and physical structure of IVR systems are used the IVR diagrams. ConceptDraw PRO software extended with Interactive Voice Response Diagrams solution allows you to make the IVR Diagrams quickly and easily.What Is a Picture Graph?
What is a Picture Graph? It's one of the most useful way which allows explain the information, statistical data in a visual form using the pictures. ConceptDraw PRO extended with Picture Graphs solution from the Graphs and Charts area offers you the easiest way of Picture Graphs drawing.
 What are Infographic Area
Solutions of the area What is Infographics from ConceptDraw Solution Park collect templates, samples and vector stencils libraries with design elements for the drawing information graphics.
What's the best ERD tool for the Mac?
What's the best ERD tool for the Mac? ConceptDraw PRO on Mac OS X supplied with Entity-Relationship Diagram (ERD) Solution from the Software Development Area for ConceptDraw Solution Park is the best ERD tool! This solution offers for ConceptDraw users so powerful drawing tools, libraries with numerous ERD objects, which will help design ER diagrams of any complexity and any design you want.What is Cloud Computing
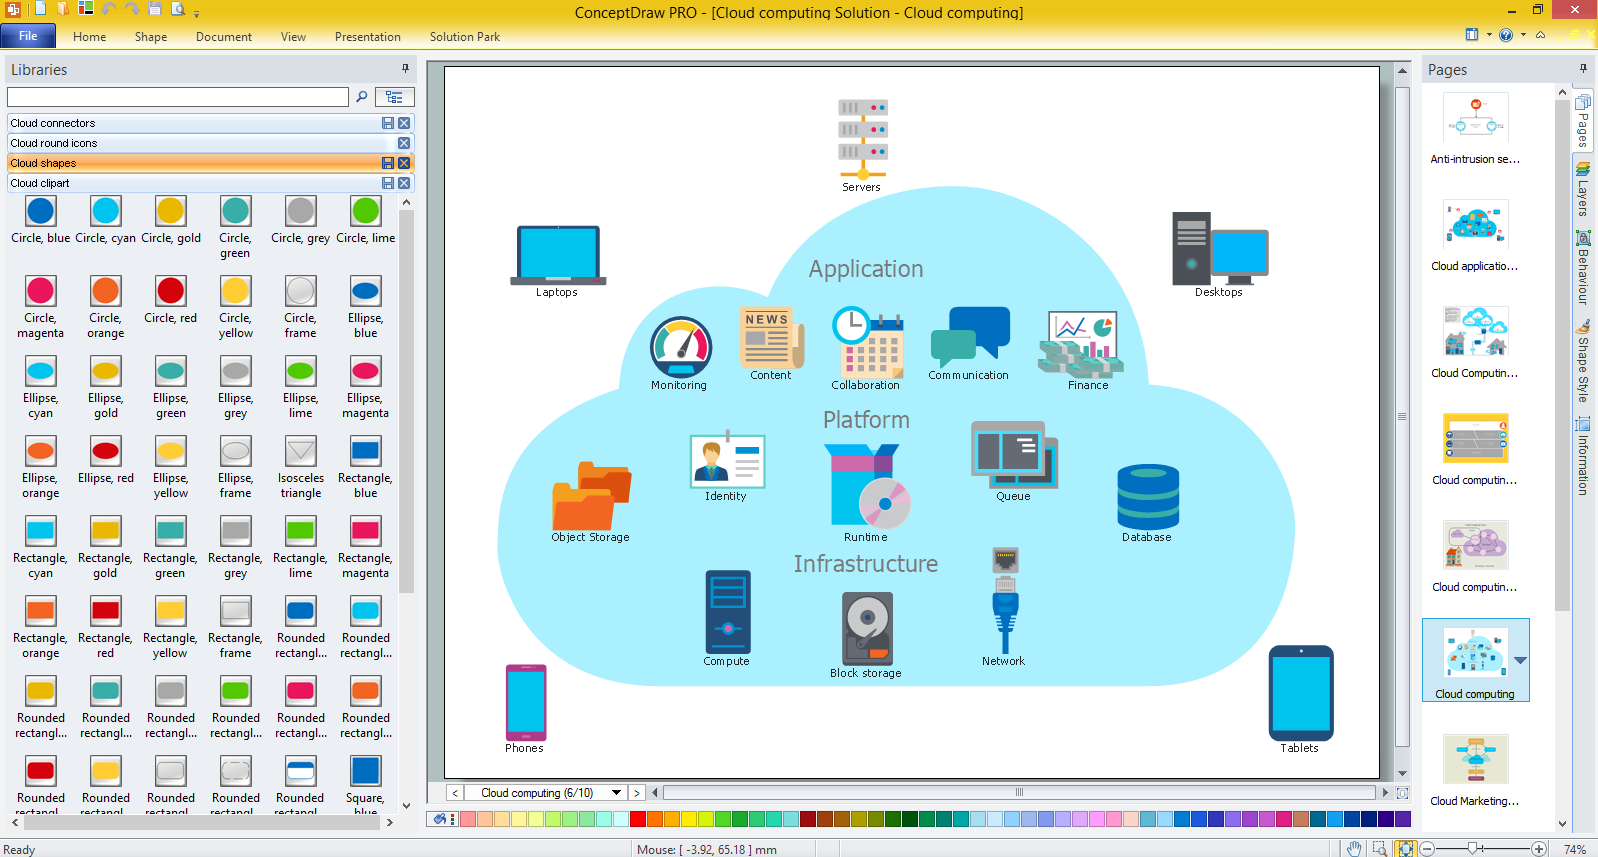
What is Cloud Computing? The Cloud computing is a widely used and highly demanded utility in the modern world thanks to its high computing power, performance, scalability and accessibility, and at the same time low cost of services. The ConceptDraw PRO diagramming and vector drawing software provides an easy and effective Cloud Computing Diagrams solution from the Computers and Network area of ConceptDraw Solution Park for making professional looking Cloud Computing and Cloud Computing Architecture Diagrams.What can go wrong if the purchasing process is not followed?
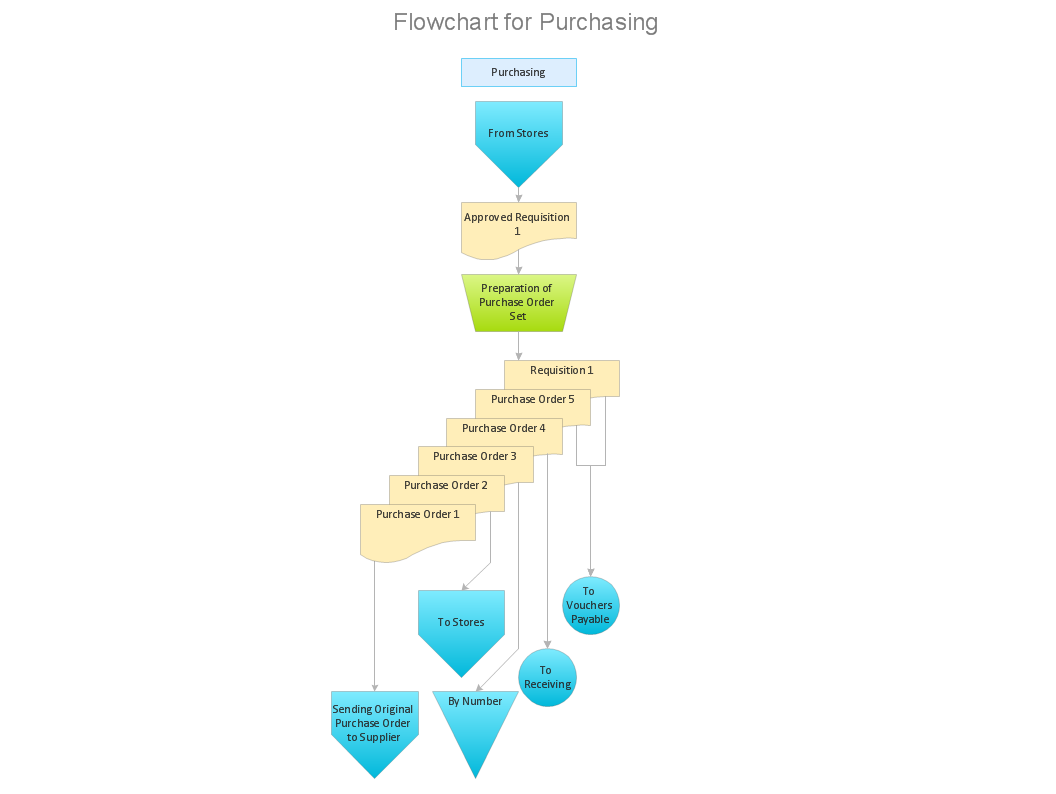
Make sure that your purchasing process complies with the standards and regulations. Common key elements of purchasing process.What Is a Line Chart
What Is a Line Chart? A line chart is a basic type of chart represented by a series of data points connected with a straight line. Explaining the meaning of “What is a line chart?” is convenient to use illustrations with professional looking line charts designed in ConceptDraw PRO diagramming and vector drawing software extended with Line Graphs solution from the Graphs and Charts area.- What Is Difference Between A Flow Chart And Cross Functional
- Total Quality Management Value | What Is 4m 1e In Quality
- What Is a Picture Graph? | How to Create Presentation of Your ...
- Steps in the Accounting Process | Steps of Accounting Cycle | How ...
- Wireless router network diagram | What Is a Wireless Network ...
- Types of Flowcharts | Types of Flowchart - Overview | Basic ...
- What Is The Significance Of A Flowchart In Problem Solving
- What Network Devices Will Be Needed To Set Up A Pan
- Audit Flowcharts | Audit Flowchart Symbols | Basic Audit Flowchart ...
- Chen Notation | Design elements - ER diagram (Chen notation ...
- What Are The Purposes Of Data Flow Diagrams Entity Relationship
- ConceptDraw Office: What Our Users Say
- Data Flow Diagram (DFD)
- Process Flow Diagram Symbols | Types of Flowcharts | Process ...
- What Type Of Floor Plan Is Suitable To Prevent Dents
- What's New in the Latest Updates of ConceptDraw Products?
- Reflected Ceiling Plans | How to Create a Reflected Ceiling Floor ...
- Internet marketing - Concept map | What Is a Concept Map | Concept ...
- What Is a Circle Spoke Diagram | Circle-Spoke Diagrams | How to ...
- SWOT Analysis | SWOT Analysis | What is SWOT Analysis in ...


