"Proteins are large biological molecules, or macromolecules, consisting of one or more chains of amino acid residues. Proteins perform a vast array of functions within living organisms, including catalyzing metabolic reactions, replicating DNA, responding to stimuli, and transporting molecules from one location to another. Proteins differ from one another primarily in their sequence of amino acids, which is dictated by the nucleotide sequence of their genes, and which usually results in folding of the protein into a specific three-dimensional structure that determines its activity.
A polypeptide is a single linear polymer chain derived from the condensation of amino acids. The individual amino acid residues are bonded together by peptide bonds and adjacent amino acid residues. The sequence of amino acid residues in a protein is defined by the sequence of a gene, which is encoded in the genetic code." [Protein. Wikipedia]
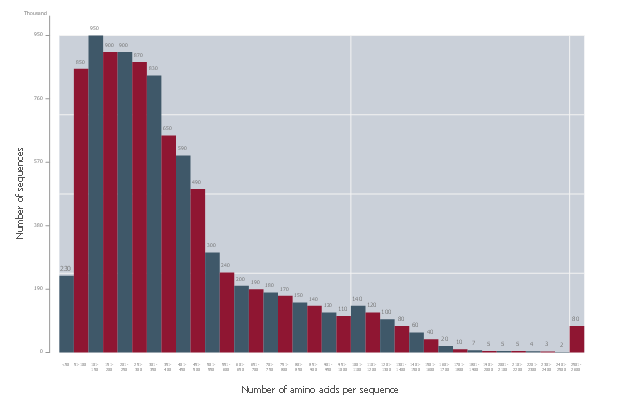
This histogram sample was redesigned from the Wikimedia Commons file: AminoAcid length distribution 2010.svg. [commons.wikimedia.org/ wiki/ File:AminoAcid_ length_ distribution_ 2010.svg]
The histogram example "Amino acid length distribution" was created using the ConceptDraw PRO diagramming and vector drawing software extended with the Histograms solution from the Graphs and Charts area of ConceptDraw Solution Park.
A polypeptide is a single linear polymer chain derived from the condensation of amino acids. The individual amino acid residues are bonded together by peptide bonds and adjacent amino acid residues. The sequence of amino acid residues in a protein is defined by the sequence of a gene, which is encoded in the genetic code." [Protein. Wikipedia]
This histogram sample was redesigned from the Wikimedia Commons file: AminoAcid length distribution 2010.svg. [commons.wikimedia.org/ wiki/ File:AminoAcid_ length_ distribution_ 2010.svg]
The histogram example "Amino acid length distribution" was created using the ConceptDraw PRO diagramming and vector drawing software extended with the Histograms solution from the Graphs and Charts area of ConceptDraw Solution Park.
Histogram
 Health Food
The Health Food solution contains the set of professionally designed samples and large collection of vector graphic libraries of healthy foods symbols of fruits, vegetables, herbs, nuts, beans, seafood, meat, dairy foods, drinks, which give powerful possi
Genomics

 Bar Graphs
The Bar Graphs solution enhances ConceptDraw PRO v10 functionality with templates, numerous professional-looking samples, and a library of vector stencils for drawing different types of Bar Graphs, such as Simple Bar Graph, Double Bar Graph, Divided Bar Graph, Horizontal Bar Graph, Vertical Bar Graph, and Column Bar Chart.
Biology Drawing

Bar Chart Template

 Biology
Biology solution extends ConceptDraw PRO software with samples, templates and libraries containing biological vector symbols, to help you create scientific and educational designs in the field of biology.
 Area Charts
Area Charts are used to display the cumulative totals over time using numbers or percentages; or to show trends over time among related attributes. The Area Chart is effective when comparing two or more quantities. Each series of data is typically represented with a different color, the use of color transparency in an object’s transparency shows overlapped areas and smaller areas hidden behind larger areas.
Biology Illustration

- Diagramatic Relationship Between Protein Metabolism And Krebs
- Interrelationship Between Carbohydrate Protein And Fat Metabolism ...
- Diagram Of Protein Cycle Or Metabolism Of Protein
- Metabolism Protein Catabolism
- Metabolism Of Proteins In Flow Chart
- Draw The Metabolic Pathway Of Protein
- Proteins
- Interrelation Of Carbohydrate Lipid And Protein Metabolism
- Interrelationship Between Carbohydrate And Protein Metabolism
- Design elements - Biochemistry of metabolism | Bio Flowchart Lite ...