 Basic Circle-Spoke Diagrams
Basic circle-spoke diagrams are well suited for marketing, management documents, and presentations.
Best Diagramming
Need to draw a diagram, process chart, flowchart, organizational chart, graphic design? ConceptDraw can help you to make professional graphic documents quickly.
Circle Diagrams
The Circle Diagrams are the diagrams which represent the central element surrounded by other items in a circle. This type of diagram is very popular and widely used in marketing and management, for process modeling, market, resource, time and cost analysis, for visualization causes and effects. If you dream to design the Circle Diagrams quick and easy – the ConceptDraw PRO software extended with Circle-Spoke Diagrams Solution from the "Diagrams" Area is exactly what you need.HelpDesk
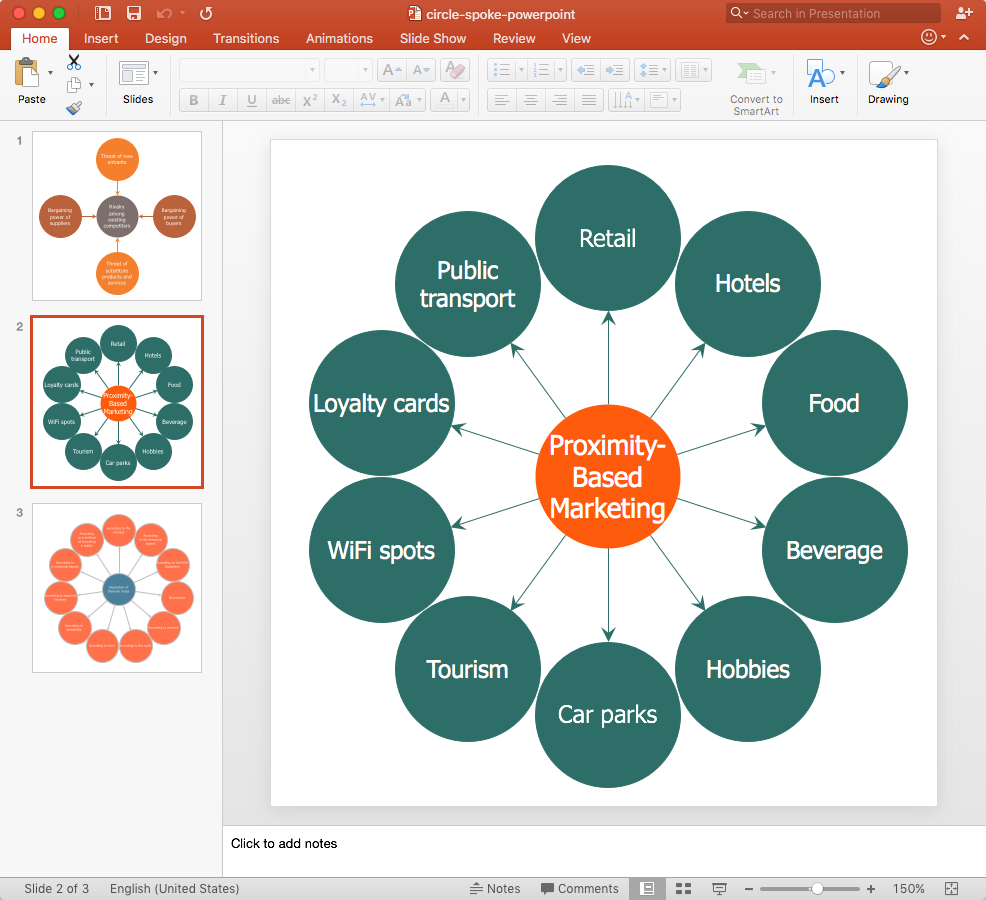
How to Add a Circle-spoke Diagram to PowerPoint
ConceptDraw PRO can be used as a tool for creating circle spoke diagrams along with other marketing diagrams. ConceptDraw PRO allows you to make a MS PowerPoint Presentation from your marketing diagrams in a few simple steps.What Is a Circle Spoke Diagram
What Is a Circle Spoke Diagram? It is a diagram which have a central item surrounded by other items in a circle. The Circle Spoke Diagrams are often used to show the features or components of the central item in marketing and management documents and presentations. ConceptDraw PRO extended with Circle-Spoke Diagrams Solution from the "Diagrams" Area is the best software for creating Circle-Spoke Diagrams.HelpDesk
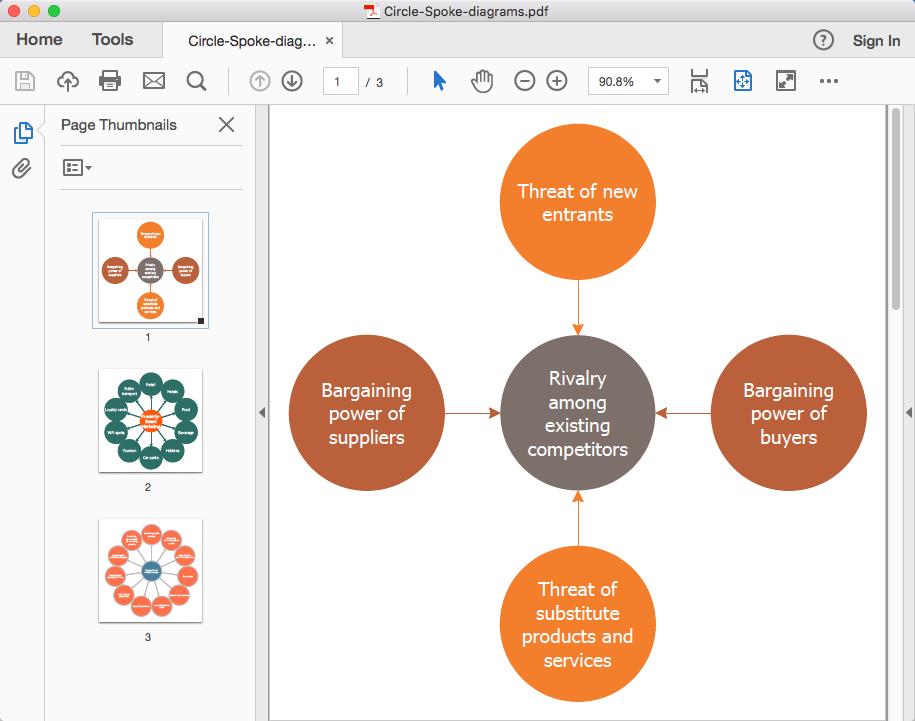
How To Convert a Circle-Spoke Diagram to Adobe PDF
ConceptDraw PRO allows you to easy share your marketing documentation between different computers with different operating systems and applications using it's export capabilities. You can get your marketing diagrams in pdf format and avoid any problems while communicating them.
 Circular Arrows Diagrams
Circular Arrows Diagrams solution extends ConceptDraw PRO v10 with extensive drawing tools, predesigned samples, Circular flow diagram template for quick start, and a library of ready circular arrow vector stencils for drawing Circular Arrow Diagrams, Segmented Cycle Diagrams, and Circular Flow Diagrams. The elements in this solution help managers, analysts, business advisers, marketing experts, scientists, lecturers, and other knowledge workers in their daily work.
Basic Flowchart Symbols and Meaning
Flowcharts are the best for visually representation the business processes and the flow of a custom-order process through various departments within an organization. ConceptDraw PRO diagramming and vector drawing software extended with Flowcharts solution offers the full set of predesigned basic flowchart symbols which are gathered at two libraries: Flowchart and Flowcharts Rapid Draw. Among them are: process, terminator, decision, data, document, display, manual loop, and many other specific symbols. The meaning for each symbol offered by ConceptDraw gives the presentation about their proposed use in professional Flowcharts for business and technical processes, software algorithms, well-developed structures of web sites, Workflow diagrams, Process flow diagram and correlation in developing on-line instructional projects or business process system. Use of ready flow chart symbols in diagrams is incredibly useful - you need simply drag desired from the libraries to your document and arrange them in required order. There are a few serious alternatives to Visio for Mac, one of them is ConceptDraw PRO. It is one of the main contender with the most similar features and capabilities.
Circles Venn Diagram
This example shows the 4 Circle Venn Diagram. The Venn Diagram visualizes all possible logical relations between several sets. The sets are represented as circles on the Venn Diagram. On this example you can see the intersections of 4 sets. Venn Diagrams are widely used in mathematics, logic, statistics, marketing, sociology, etc.Entity Relationship Diagram Symbols
The semantic modeling method nowadays is successfully applied in database structure design. It is effective method of modeling the data structures, which is based on the meaning of these data. As a tool of semantic modeling, there are used different types of Entity-Relationship Diagrams. Entity Relationship Diagram (ERD) is applied to visually and clearly represent a structure of a business database. The main components of ERDs are: entity, relation and attributes. An entity is a class of similar objects in the model, each entity is depicted in the form of rectangle and has the name expressed by a noun. Relation is shown in the form of non-directional line that connects two entities. There are several notation styles used for ERDs: information engineering style, Chen style, Bachman style, Martin Style. The Entity Relationship Diagram symbols used for professional ERD drawing are predesigned by professionals and collected in the libraries of the Entity-Relationship Diagram (ERD) solution for ConceptDraw PRO software.- Pie Chart Examples and Templates | Circle -Spoke Diagrams | Pie ...
- The Diagram Of Business Circle
- Basic Flowchart Symbols and Meaning | 3 Circle Venn Diagram ...
- Business Circle Diagram Template
- Diagrams On How To Explain The Circle Of Business
- Graphical Representatuon Of Business Circle
- With The Aid Of Diagram Explain Project Circle
- Diagram Of The Business Operation Circle
- Marketing mix - Wheel diagram | Target diagrams - Vector stencils ...


