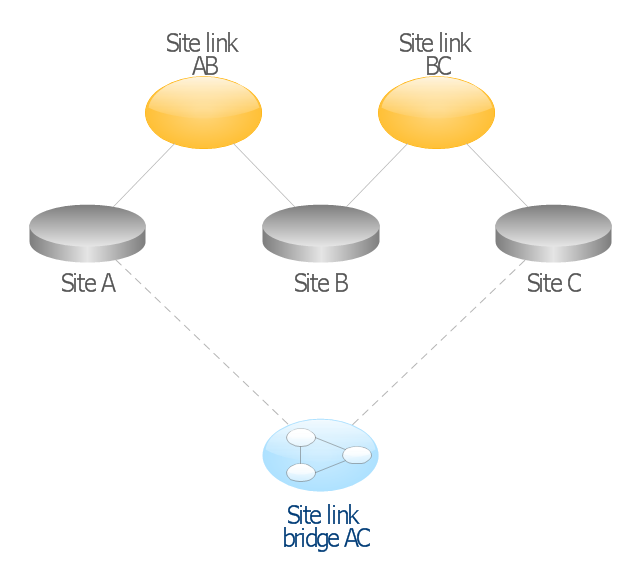
This AD diagram example was redesigned from the picture "Site links" from the book "Active Directory for Dummies".
"Site links represent the Active Directory replication paths between sites.
These paths are manually defined so that the designer has control over which network links the replication traffic occurs on. These site links also control how clients are directed to domain controllers when there’s no DC in the client’s local site. Each site link has the following attributes:
(1) Connected sites: A site link is defined by the sites to which it connects. A site link can connect two or more sites together.
(2) Network transport: Site links support replication communication over IP-based RPCs or with the Simple Mail Transport Protocol (SMTP). You normally want to use RPC whenever possible, but you can use SMTP when the sites you’re linking don’t support RPC.
(3) Cost: Each site link has a cost associated with it. Costs are used to assign preferences to links that determine which link should be followed when multiple link paths are available between sites. The cost represents what it “costs” to use this site link relative to the other site links and affects replication traffic as well as how users are assigned a domain controller. Links with lower cost values have preference over links with higher cost values. Cost values range from 1–32,767; the default being 100.
(4) Frequency: The frequency value defines how often a replication occurs
when using this site link (the replication latency). You can configure the time between replications from a minimum of 15 minutes to a maximum of 10,080 minutes (one week). The default frequency is 180 minutes.
(5) Schedule: The schedule dictates when this link is active and available for replication between the sites. The schedule can also control which days of the week the link is available. Normally, the schedule is set so that the link is available 24 hours a day, but you can set up different schedules on a per-day-of-the-week basis.
By creating a site link, you enable two or more sites to be connected and to share the same site link attributes (transport, cost, frequency, and schedule). By default, site links create transitive connectivity between sites.
If you create a site link between sites A and B and another site link between
sites B and C, an automatic connection (known as a site link bridge) is created between sites A and C..." [Steve Clines and Marcia Loughry, Active Directory® For Dummies®, 2nd Edition. 2008]
The Active Directory diagram example "Site links" was created using the ConceptDraw PRO diagramming and vector drawing software extended with the Active Directory Diagrams solution from the Computer and Networks area of ConceptDraw Solution Park.
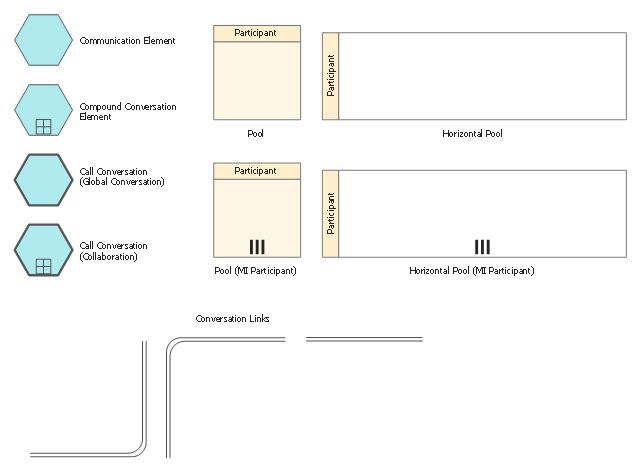
The vector stencils library "Conversations" contains 11 symbols: communication element, compound conversation element, call conversation (global and collaboration), conversation links, pools. Use these shapes for drawing BPMN 2.0 conversation diagrams using the ConceptDraw PRO diagramming and vector drawing software.
"Conversation-Model.
The new Conversation-Model is used to model a "who with whom and what"-view of processes. All process participants can be included in a compact form of modeling as long as denoting which communication is involved.
Process participants are represented as Pools (collapsed...) in Conversation-Models. The Communication-Shape defines a set of logically related message exchanges which are tied to Pools via Conversation-Links. If there is a multi-instanced Pool (also introduced with BPMN 2.0) involved, a Forked Conversation-Link is used for it.
Furthermore Sub-Conversations can be used to define abstractions." [en.bpmn-community.org/ tutorials/ 34/ ]
The example "Design elements - Conversations (BPMN 2.0)" is included in the Business Process Diagram solution from the Business Processes area of ConceptDraw Solution Park.
HelpDesk
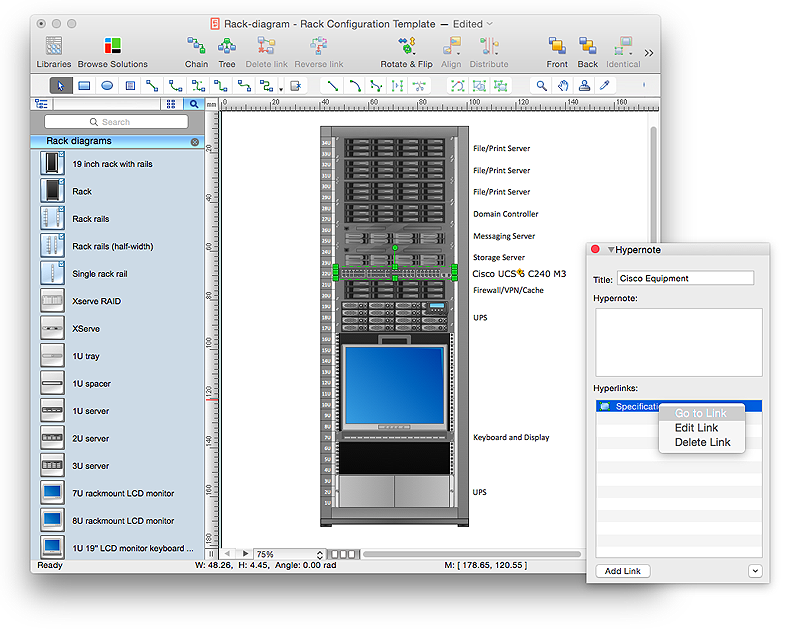
How to Create a Rack Diagram in ConceptDraw PRO
A Rack Diagram represents the rack mounting of network and computer equipment that is installed as a server. Rack diagrams are used by system administrators and network architectors when making a decision regarding the purchase of network equipment. It is used to show how a particular server configuration can be composed, without making its physical installation. ConceptDraw PRO enhanced with the Rack Diagrams Solution can be successfully used for making various rack diagrams. It's important that the solution used to create a rack diagram contains templates that stick to industry standards, and supplies a big selection of device icons to cover multiple types of equipment for a number of network configurations.HelpDesk
How to Edit a Project Task List
A list of a project tasks is core to any project plan. It is the basic part of a project schedule. The project task list should include all of the work associated with fulfilling the project on time. Having an entire and complete task list, the project manager will be able to estimate the costs and resources, necessary to implement the project. The project task list creation is a key piece of project management. The list of project tasks have include activities, should be performed, and the sequence in which tasks need to be completed.
 PM Docs
This solution extends ConceptDraw MINDMAP software with the ability to organize project and company documentation and structure information that relates to your project.
 ConceptDraw Solution Park
ConceptDraw Solution Park collects graphic extensions, examples and learning materials
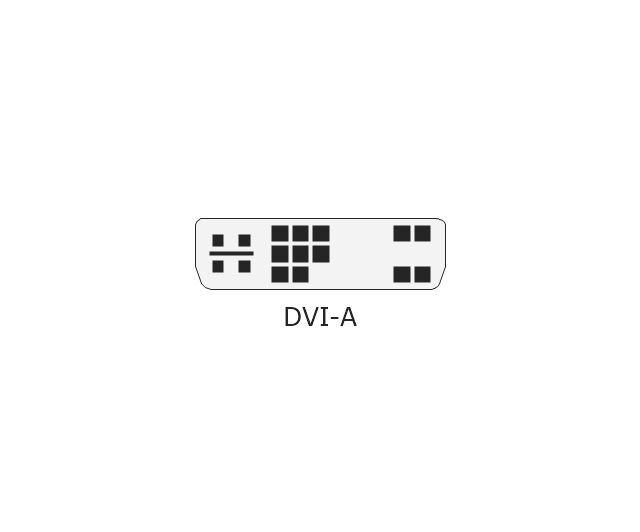
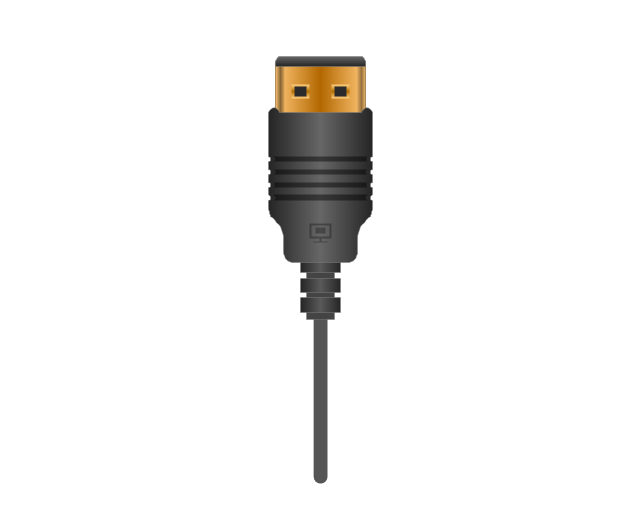
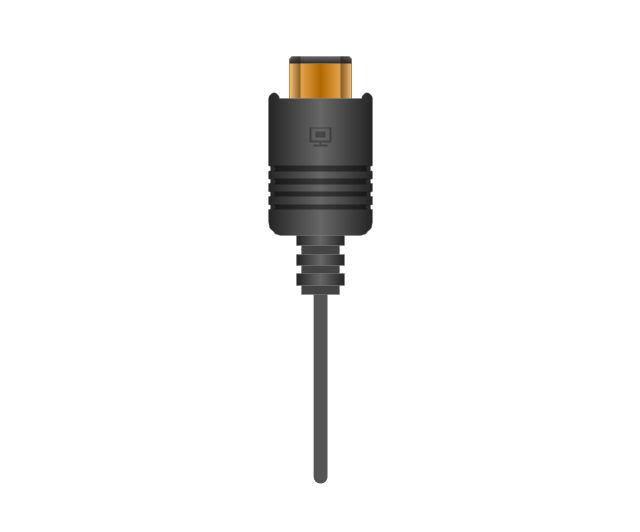
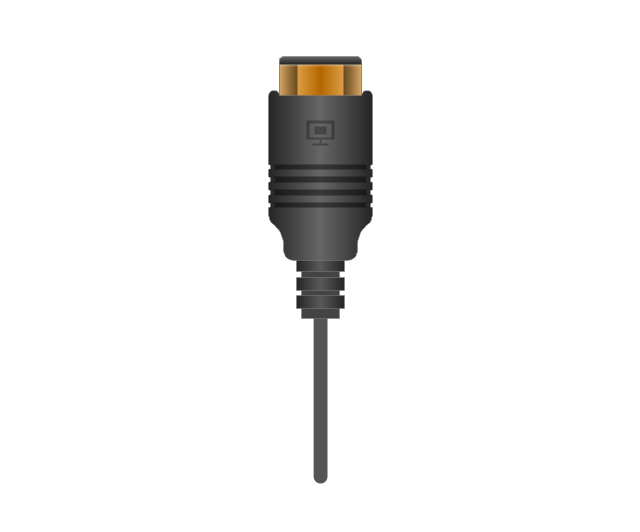
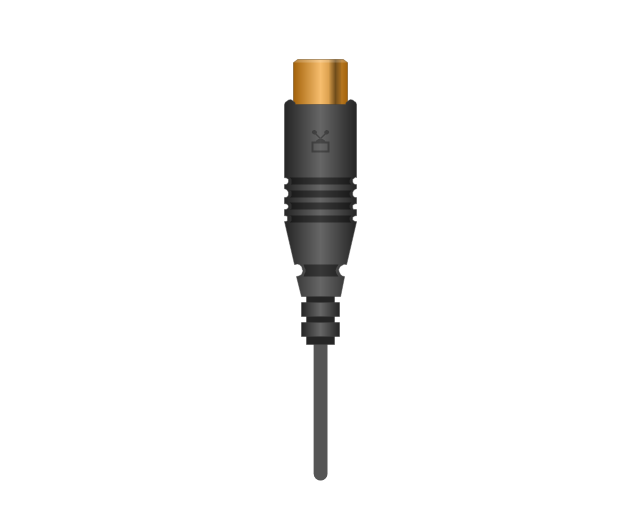
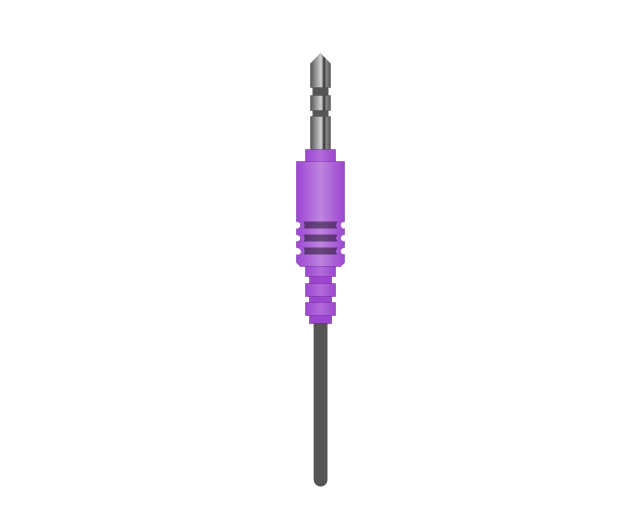
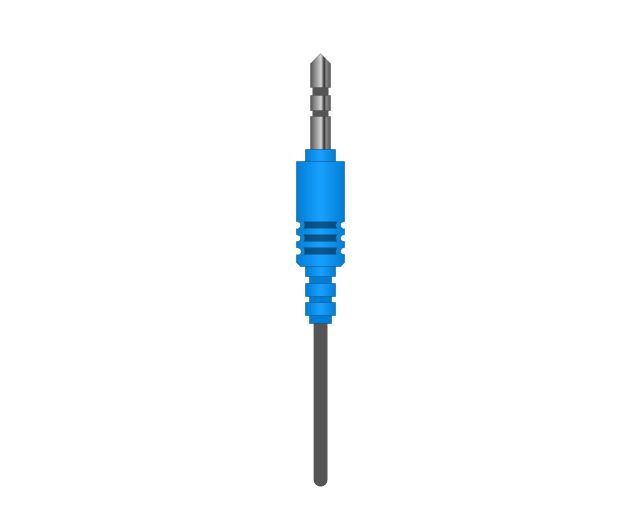
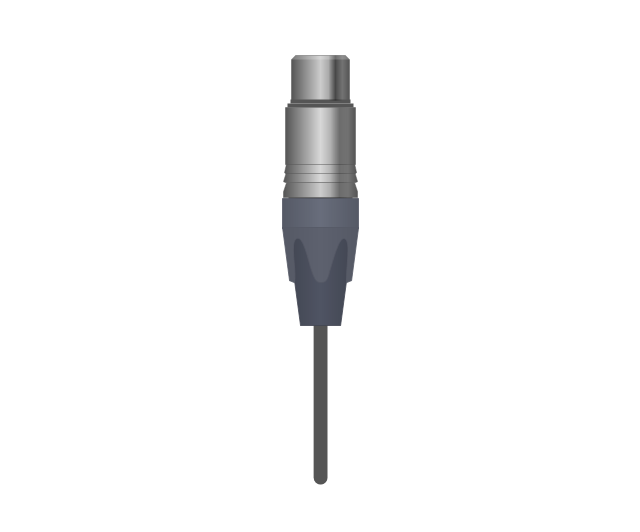
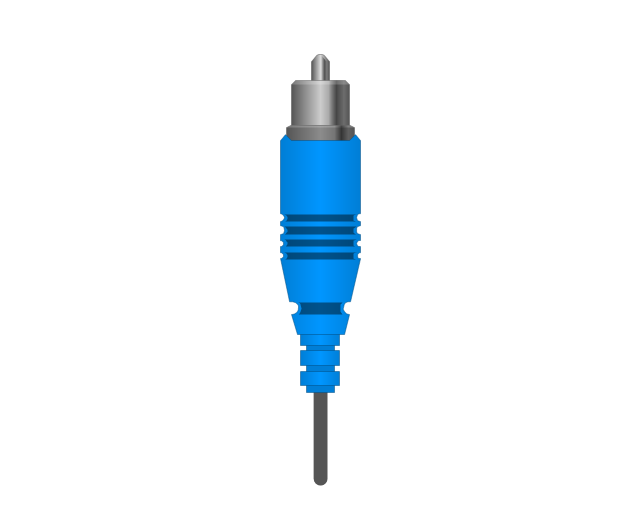
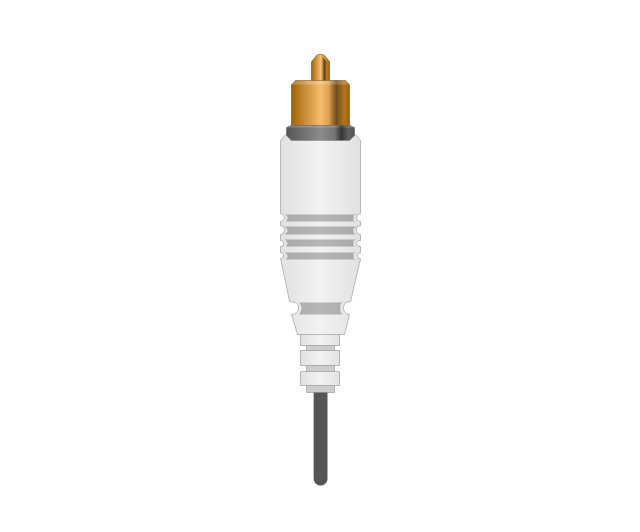
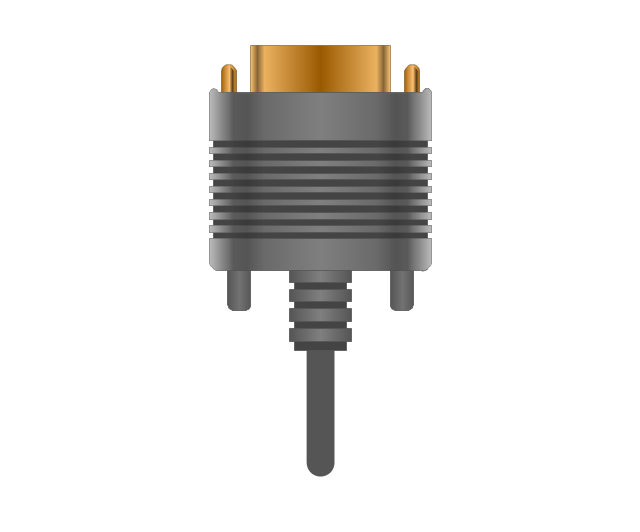
The vector stencils library "Audio and video connectors" contains 94 symbols of audio and video connectors and device silhouettes.
Use these jacks and plugs clipart icons for drawing hook up diagrams in the ConceptDraw PRO diagramming and vector drawing software extended with the Audio and Video Connectors solution from the Engineering area of ConceptDraw Solution Park.
www.conceptdraw.com/ solution-park/ engineering-audio-video-connectors
What is Gantt Chart (historical reference)
Historical reference about the Gantt chart.HelpDesk
How to Connect Text Data to a Time Series Chart on Your Live Dashboard
Time Series Dashboard means an integration of some type of diagrams: Line Charts, Bar Charts, Column Charts, and Dot Plots on a single space. The ConceptDraw Time Series Dashboard solution can be used to create the interactive Time Series dashboard. The libraries of Time Series Charts solution contain the Live Objects, that can change their appearance depending on the external data. Each chart from the Time Series dashboard displays particular source data. You can include Time Series Charts in your business or technical dashboards to show and compare the items changing over time.
 Concept Maps
The technique of concept mapping was developed as a constructive way of representing knowledge in science and increasing the meaningfulness of learning. Now, the creation of a concept map is extremely helpful when used in education as learning and teaching techniques that assist memorization. Concept maps are also used for idea generation in brainstorming sessions, and for detailing the structure of complex ideas.
- How To Link Task Using Conceptdraw
- Vector stencils library - IDEF3 process schematic symbols | Vector ...
- Comm Link Png Transparrent
- Activity Diagrams For Wireless Setup Link
- Link Diagram Software
- Telecommunication Network Diagrams | Telecommunication ...
- Open Link Data
- Memory Object Diagram | Design elements - UML object diagrams ...
- Active Directory Sites and Services - Vector stencils library | Active ...
- Link
- Link Network Png
- Link Diagram Software Free
- Linking
- Active Directory Diagram
- Fully Connected Network Topology Diagram | Overlay network ...
- Road Transport - Design Elements | How to Create a Vehicular ...
- Show Diagramatically The Link Between The Basic Components Of
- Controls - Vector stencils library | Ribbon interface - Vector stencils ...
- Active Directory Domain Services | Design Element: Active Directory ...









-jack-audio-and-video-connectors---vector-stencils-library.png--diagram-flowchart-example.png)
-jack-audio-and-video-connectors---vector-stencils-library.png--diagram-flowchart-example.png)
-jack-audio-and-video-connectors---vector-stencils-library.png--diagram-flowchart-example.png)
-jack-audio-and-video-connectors---vector-stencils-library.png--diagram-flowchart-example.png)

-audio-and-video-connectors---vector-stencils-library.png--diagram-flowchart-example.png)
-audio-and-video-connectors---vector-stencils-library.png--diagram-flowchart-example.png)
-audio-and-video-connectors---vector-stencils-library.png--diagram-flowchart-example.png)
-audio-and-video-connectors---vector-stencils-library.png--diagram-flowchart-example.png)
