 Logistics Flow Charts
Logistics Flow Charts solution extends ConceptDraw PRO v11 functionality with opportunities of powerful logistics management software. It provides large collection of predesigned vector logistic symbols, pictograms, objects and clipart to help you design with pleasure Logistics flow chart, Logistics process flow diagram, Inventory flow chart, Warehouse flowchart, Warehouse management flow chart, Inventory control flowchart, or any other Logistics diagram. Use this solution for logistics planning, to reflect logistics activities and processes of an enterprise or firm, to depict the company's supply chains, to demonstrate the ways of enhancing the economic stability on the market, to realize logistics reforms and effective products' promotion.
HelpDesk
How to Make a Logistics Flow Chart

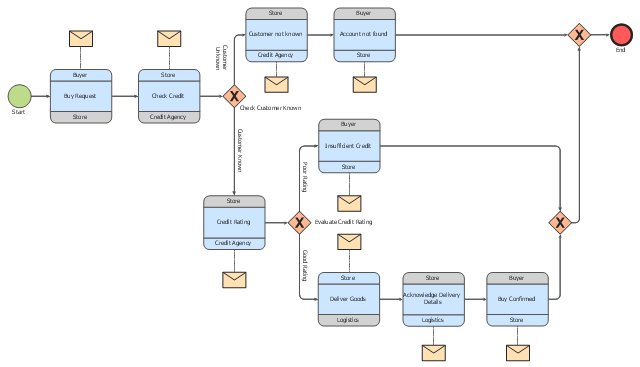
This choreography BPMN (Business Process Model and Notation) diagram sample shows the logistics workflow.
"Logistics is the management of the flow of goods between the point of origin and the point of consumption in order to meet some requirements, for example, of customers or corporations. The resources managed in logistics can include physical items, such as food, materials, animals, equipment and liquids, as well as abstract items, such as time, information, particles, and energy. The logistics of physical items usually involves the integration of information flow, material handling, production, packaging, inventory, transportation, warehousing, and often security. The complexity of logistics can be modeled, analyzed, visualized, and optimized by dedicated simulation software. The minimization of the use of resources is a common motivation in logistics for import and export." [Logistics. Wikipedia]
The business process modeling diagram example "Logistics - Choreography BPMN 2.0 diagram" was designed using the ConceptDraw PRO diagramming and vector drawing software extended with the Business Process Diagram solution from the Business Processes area of ConceptDraw Solution Park.
Business process modeling
Business Process Modeling

 Logistic Dashboard
The powerful tools of Logistic Dashboard solution and specially developed live graphic objects of logistic icons, logistic navigation elements, logistic indicators, logistic charts and logistic maps effectively assist in designing Logistic dashboards, Logistic maps, Logistic charts, diagrams and infographics. The included set of prebuilt samples and quick-start templates, demonstrates the power of ConceptDraw PRO software in logistics management, its assisting abilities in development, realization and analyzing the logistic processes, as well as in perfection the methods of logistics management.
 Event-driven Process Chain Diagrams
Event-driven Process Chain (EPC) Diagram is a type of flowchart widely used for modeling in business engineering and reengineering, business process improvement, and analysis. EPC method was developed within the Architecture of Integrated Information Systems (ARIS) framework.
 Business Process Diagrams
Business Process Diagrams solution extends the ConceptDraw PRO BPM software with RapidDraw interface, templates, samples and numerous libraries based on the BPMN 1.2 and BPMN 2.0 standards, which give you the possibility to visualize equally easy simple and complex processes, to design business models, to quickly develop and document in details any business processes on the stages of project’s planning and implementation.
HelpDesk
How to Make a Logistic Dashboard

 Scatter Diagrams
The Scatter Diagrams solution extends ConceptDraw PRO v10 functionality with templates, samples, and a library of vector stencils that make construction of a Scatter Plot easy. The Scatter Chart Solution makes it easy to design attractive Scatter Diagrams used in various fields of science, work, and life activities. ConceptDraw PRO lets you enter the data to the table and construct the Scatter Plot Graph automatically according to these data.
- Logistics Flow Charts | Process Flowchart | How to Make a Logistics ...
- Diagram Of Business Logistics
- Logistics Flow Charts | Process Flowchart | Bar Diagrams for ...
- CS Odessa Announces Logistics Flow Charts Addition to ...
- Sample Flow Chart For Logistics Processes
- Logistics Flow Charts | Block Diagrams | Process Flowchart | Block ...
- How to Make a Logistics Flow Chart | Production Flow
- Inbound And Outbound Logistics Diagram
- Process Flowchart | Logistics Flow Charts | How to Make a Logistics ...
- Logistics Flow Diagram