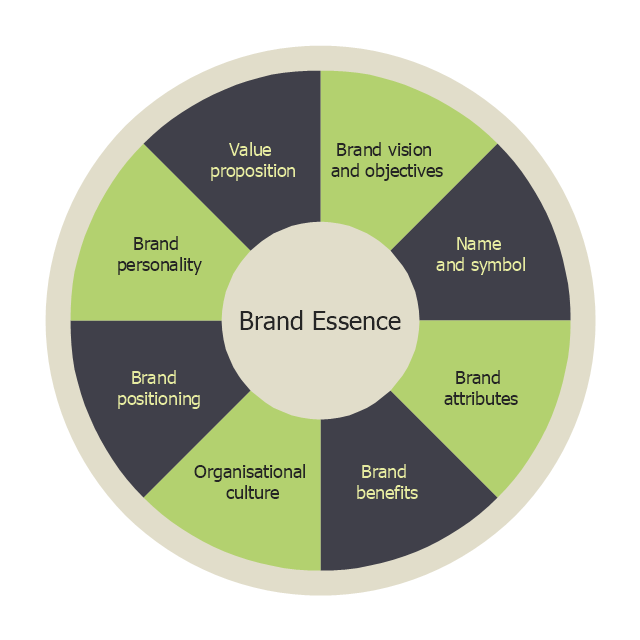
"Brand essence is a phrase that communicates the fundamental nature of a trade name associated with one or more products made by the same company. A business marketing team will often spend considerable time developing effective ways of expressing the brand essence of their company's various brands by highlighting the unique benefits provided that pertain to the values of its target subculture." [businessdictionary.com/ definition/ brand-essence.html]
Brand essence model diagram visually display key points of brand essence in easy to understand form.
The example of wheel diagram (ring diagram, bevel style circle diagram) "Brand essence model" was created using the ConceptDraw PRO diagramming and vector drawing software extended with the Target and Circular Diagrams solution from the Marketing area of ConceptDraw Solution Park.
www.conceptdraw.com/ solution-park/ marketing-target-and-circular-diagrams
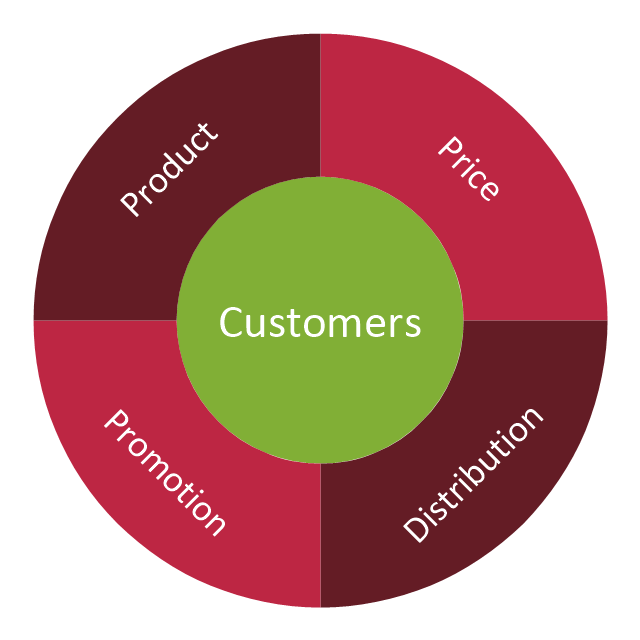
"The marketing mix is a business tool used in marketing and by marketing professionals. The marketing mix is often crucial when determining a product or brand's offer, and is often synonymous with the four Ps: price, product, promotion, and place ..." [Marketing mix. Wikipedia]
The example of wheel diagram (ring diagram, bevel style circle diagram, circular diagram) "Marketing mix" was created using the ConceptDraw PRO diagramming and vector drawing software extended with the Target and Circular Diagrams solution from the Marketing area of ConceptDraw Solution Park.
www.conceptdraw.com/ solution-park/ marketing-target-and-circular-diagrams
Target Diagram
Target Diagram is a convenient and visual way of presentation information which is popular and widely used in marketing, business and economics. ConceptDraw PRO diagramming and vector drawing software extended with Target and Circular Diagrams solution from the Marketing area of ConceptDraw Solution Park is ideal for fast and easy drawing a Target Diagram.
 Target and Circular Diagrams
This solution extends ConceptDraw PRO software with samples, templates and library of design elements for drawing the Target and Circular Diagrams.
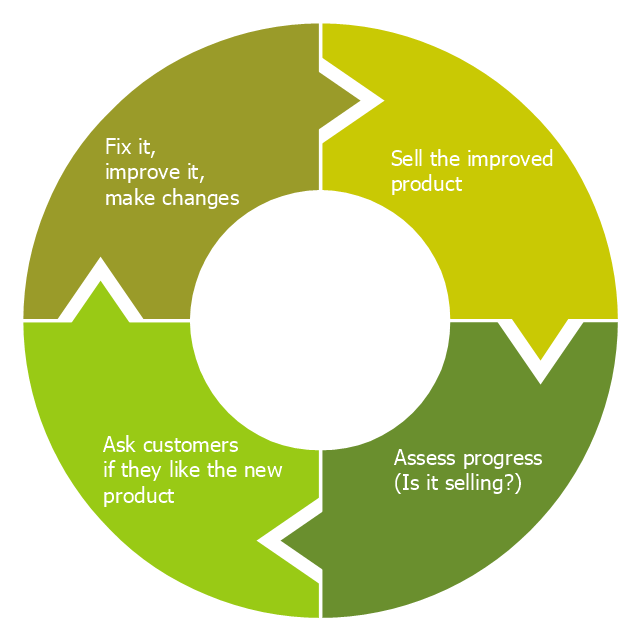
"Feedback is a process in which information about the past or the present influences the same phenomenon in the present or future. As part of a chain of cause-and-effect that forms a circuit or loop, the event is said to "feed back" into itself. ...
Feedback loop - the complete causal path that leads from the initial detection of the gap to the subsequent modification of the gap. ...
Feedback is commonly divided into two types - usually termed positive and negative. The terms can be applied in two contexts:
(1) the altering of the gap between reference and actual values of a parameter, based on whether the gap is widening (positive) or narrowing (negative),
(2) the valence of the action or effect that alters the gap, based on whether it has a happy (positive) or unhappy (negative) emotional connotation to the recipient or observer." [Feedback. Wikipedia]
This cycle diagram example was redesigned from the Wikimedia Commons file: Business Feedback Loop.jpg. [commons.wikimedia.org/ wiki/ File:Business_ Feedback_ Loop.jpg]
This file is made available under the Creative Commons CC0 1.0 Universal Public Domain Dedication. [creativecommons.org/ publicdomain/ zero/ 1.0/ deed.en]
The ring chart example "Business feedback loop" was created using the ConceptDraw PRO diagramming and vector drawing software extended with the Target and Circular Diagrams solution from the Marketing area of ConceptDraw Solution Park.
www.conceptdraw.com/ solution-park/ marketing-target-and-circular-diagrams
- Marketing mix - Wheel diagram | Marketing Diagrams | Target ...
- Brand essence model - Wheel diagram | Pyramid Chart Examples ...
- Marketing mix - Wheel diagram
- Brand essence model - Wheel diagram | Marketing mix - Wheel ...
- Marketing mix - Wheel diagram | Brand essence model - Wheel ...
- Marketing Diagrams | Marketing mix - Wheel diagram | Block ...
- Marketing mix - Wheel diagram | Marketing Diagrams | Marketing ...
- Brand essence model - Wheel diagram
- Marketing mix - Wheel diagram | Marketing | Circle-spoke diagram ...
- Marketing mix - Wheel diagram | Marketing mix diagram | Target ...
- Marketing Diagrams | Marketing Analysis Diagram | Marketing mix ...
- Marketing mix - Wheel diagram | Rail transport - Design elements ...
- Diagrams For Promotion
- Marketing | Marketing mix - Wheel diagram | Circle-spoke diagram ...
- Wheel diagram template | Rail transport - Design elements | Wheel ...
- Brand essence model - Wheel diagram | Target and Circular ...
- Marketing mix - Wheel diagram | Marketing Analysis Diagram ...
- Event-driven Process Chain Diagrams EPC | Brand essence model ...
- Marketing mix - Wheel diagram | Marketing Diagrams | Promotion ...
- Marketing Diagrams | Brand essence model - Wheel diagram ...


