HelpDesk
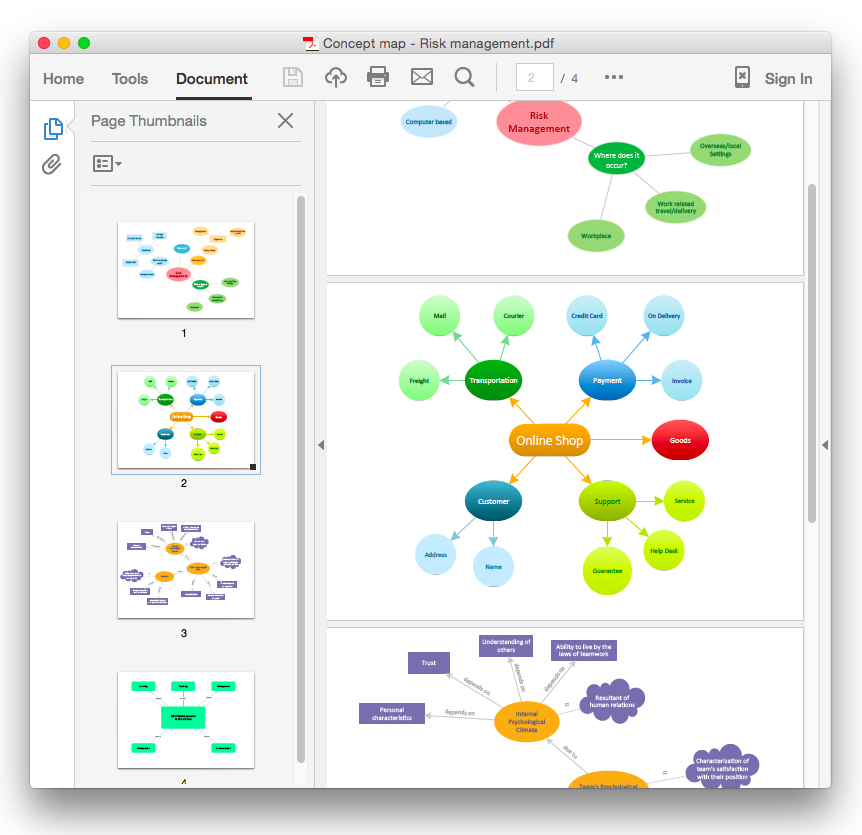
How To Convert a Concept Map to Adobe PDF Using ConceptDraw PRO
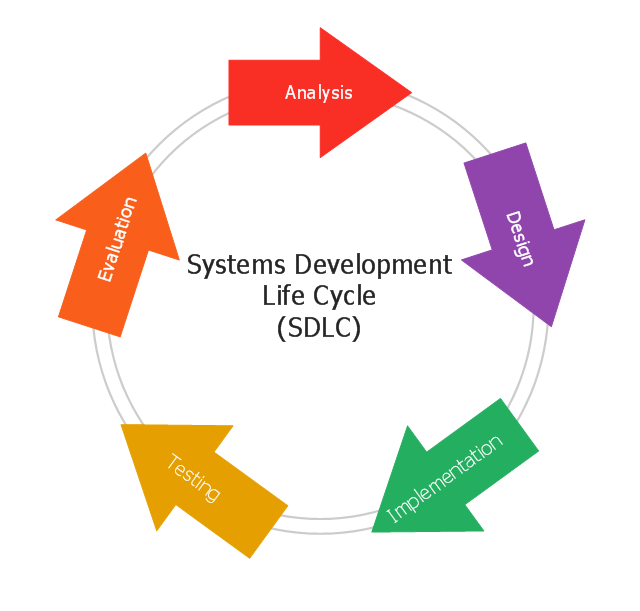
ConceptDraw PRO allows you to easy share your concept maps between different computers with different operating systems and applications using it's export capabilities.You can get clear business graphic pack in pdf format and easily communicate it with stakeholders.This circular arrows diagram sample shows the systems development life cycle (SDLC) stages.
"The systems development life cycle (SDLC), also referred to as the application development life-cycle, is a term used in systems engineering, information systems and software engineering to describe a process for planning, creating, testing, and deploying an information system. The systems development life-cycle concept applies to a range of hardware and software configurations, as a system can be composed of hardware only, software only, or a combination of both." [Systems development life-cycle. Wikipedia]
The arrow circle diagram example "Systems development life cycle" was created using the ConceptDraw PRO diagramming and vector drawing software extended with the Circular Arrows Diagrams solution from the area "What is a Diagram" of ConceptDraw Solution Park.
HelpDesk
Downloading the Old Versions of ConceptDraw Products
These are the last updates that were released for the previous versions of ConceptDraw products.
 Concept Maps
The technique of concept mapping was developed as a constructive way of representing knowledge in science and increasing the meaningfulness of learning. Now, the creation of a concept map is extremely helpful when used in education as learning and teaching techniques that assist memorization. Concept maps are also used for idea generation in brainstorming sessions, and for detailing the structure of complex ideas.
Total Quality Management with ConceptDraw
Total Quality Management (TQM) system is the management method where the confidence in quality of all organization processes is placed foremost. The given method is widely used in production, in educational system, in government organizations and so on.HelpDesk
How to Draw a Block Diagram in ConceptDraw PRO
Block diagram is a simple chart that use blocks to show some elements or activities, and connectors that show the relationship between neighboring blocks. They are commonly simple, giving an overview of a process without necessarily going into the specifics of implementation. Block diagrams are commonly used to depict a general description of a system and its activity. A most known sample of a block diagram is a flow chart, used in many types of business as a common method of representing repeated processes. Easy and a simple creation, a number of objects and connectors make the block diagram a many-sided tool for various industries. The ability to make block diagrams is delivered by the ConceptDraw Block Diagrams solution.- Chemical Communication Endocrine System Concept Map
- Chemical Communication In The Endocrine System Concept Map
- Concept Map Of Cashiering System
- Basic CCTV System Diagram. CCTV Network Diagram Example ...
- Concept Maps | How To Create a Concept Map in Visio Using ...
- Chart Of Management Information System With Diagram
- Conceptdraw.com: Mind Map Software, Drawing Tools | Project ...
- Process Flowchart | Concept Maps | How To Make a Concept Map ...
- General Concept Of The Intelligent Transport System
- Process Flowchart | Basic Diagramming | Concept Maps | Chemical ...
- Pyramid Model Concept Map
- Concept Map Of Charts Of Accounts
- Software Defined Networking System Overview | Venn Diagrams ...
- Concept Maps | Mathematics Symbols | Sentence Diagram ...
- Logistics Flow Charts | Office Layout Plans | Concept Maps | Dfd ...
- Concept Maps | Bubble Diagrams | Mac Diagramming Software ...
- Concept Used In Constructing Data Flow Diagram
- Celestial Bodies Concept Map
- Concept Maps | What Is a Concept Map | How To Make a Concept ...
- What Is a Concept Map | Concept Maps | How To Make a Concept ...


