Planogram Software and Retail Plan Software
The ConceptDraw DIAGRAM Planogram Software and Retail Plan Software offers powerful tools of Enterprise Architecture Diagrams Solution for visualization the market analysis and easy making successful Retail Plans and Planograms with useful detailed recommendations about placing products and optimization the shelf space.Restaurant Floor Plans Samples
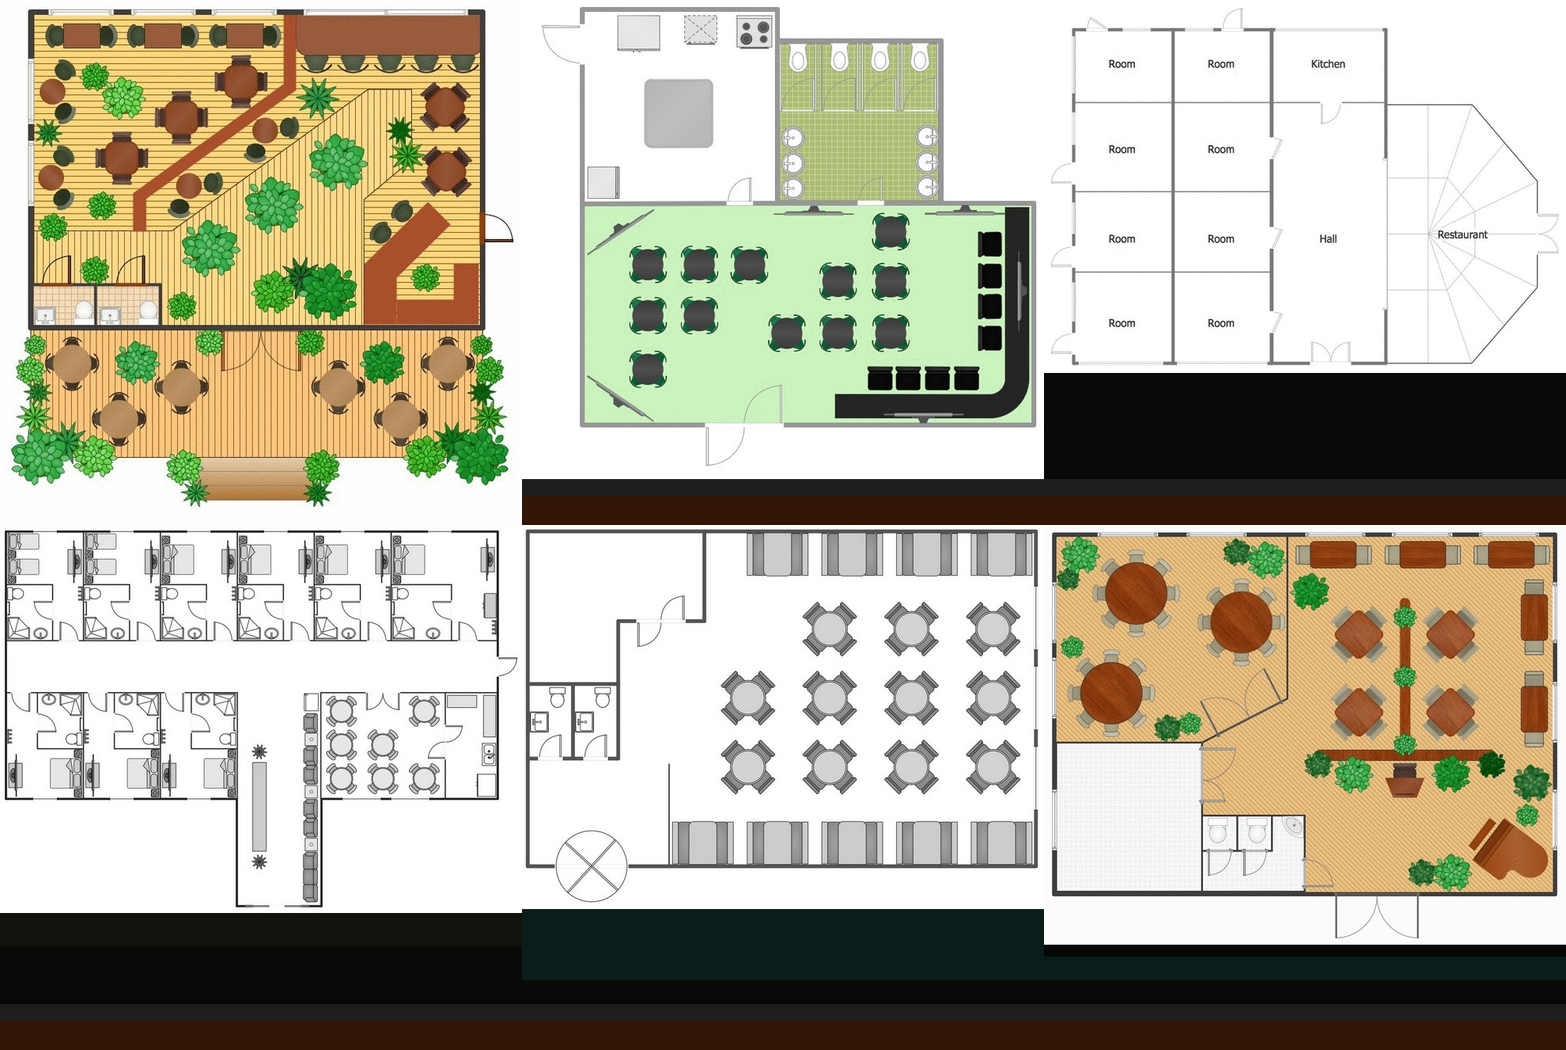
Imagine a place for socialization, comfort, relax and memories - restaurant. It is more than just food enterprise. Atmosphere and appearance of the whole restaurant and separately of each area, whether dining room, bar, waiting lounge, or restroom, are most important points. The idea behind the restaurant greatly determines materials, the flow of spaces and placement of walls. Design also should to be functional and practical to increase the staff productivity and sales. Thinking a lot about architecture, design and menu of the restaurant, don't forget about safety, ergonomy and profitability. When you planning to open a restaurant, you have create Restaurant Layout Plan, Restaurant Floor Plan, Restaurant Design Plan, Restaurant Electrical Plan, Emergency Plan, Plan of Furniture Arrangement, Landscape Design Plan. Sounds complicated? No worries, ConceptDraw DIAGRAM extended with Cafe and Restaurant Floor Plan solution contains variety of Restaurant Floor Plans samples, templates and predesigned objects which will help you in successful planning and designing your new restaurant or renovation an existing one.CORRECTIVE ACTIONS PLANNING. Involvement Matrix
The Involvement Matrix can identify the distribution of responsibilities and identify roles in a group or team. Use the Involvement Matrix to specify roles and responsibilities of actions in problem solving. ConceptDraw Office suite is a software for corrective actions planning.
Bubble diagrams in Landscape Design with ConceptDraw DIAGRAM
Bubble Diagrams are the charts with a bubble presentation of data with obligatory consideration of bubble's sizes. They are analogs of Mind Maps and find their application at many fields, and even in landscape design. At this case the bubbles are applied to illustrate the arrangement of different areas of future landscape design, such as lawns, flowerbeds, playgrounds, pools, recreation areas, etc. Bubble Diagram helps to see instantly the whole project, it is easy for design and quite informative, in most cases it reflects all needed information. Often Bubble Diagram is used as a draft for the future landscape project, on the first stage of its design, and in case of approval of chosen design concept is created advanced detailed landscape plan with specification of plants and used materials. Creation of Bubble Diagrams for landscape in ConceptDraw DIAGRAM software is an easy task thanks to the Bubble Diagrams solution from "Diagrams" area. You can use the ready scanned location plan as the base or create it easy using the special ConceptDraw libraries and templates.ERD Symbols and Meanings
Entity Relationship Diagram (ERD) is a popular software engineering tool for database modeling and illustration the logical structure of databases, which uses one of two notations - Chen's or Crow’s Foot. Crow's foot notation is effective when used in software engineering, information engineering, structured systems analysis and design. Each of these notations applies its own set of ERD symbols. Crow's foot diagrams use boxes to represent entities and lines between these boxes to show relationships. Varied shapes at the ends of lines depict the cardinality of a given relationship. Chen's ERD notation is more detailed way to represent entities and relationships. ConceptDraw DIAGRAM application enhanced with all-inclusive Entity-Relationship Diagram (ERD) solution allows design professional ER diagrams with Chen's or Crow’s Foot notation on your choice. It contains the full set of ready-to-use standardized ERD symbols and meanings helpful for quickly drawing, collection of predesigned ERD samples, examples and templates. ConceptDraw Pro is a great alternative to Visio for Mac users as it offers more features and can easily handle the most demanding professional needs.
Competitor Analysis
Competitor analysis is a first and obligatory step in elaboration the proper corporate marketing strategy and creating sustainable competitive advantage. Use powerful opportunities of numerous solutions from ConceptDraw Solution Park for designing illustrative diagrams, charts, matrices which are necessary for effective competitor analysis.Data Flow Diagram Symbols. DFD Library
Data Flow Diagrams graphically represent the information transfers and process steps of a system. They visually depict how data are processed by a system in terms of inputs and outputs, how occurs the input in a system, how the data flow through an information system and where they are stored, and how occurs output from the system. DFDs give the overview of the system and models the processes aspects, they are maintained with other methods of structured systems analysis. The main goal of DFDs is achievement of understanding between developers and users. For their construction are used two notations - Gane-Sarson and Yourdon, each of them uses its own set of symbols. Data Flow Diagrams solution from Software Development area extends the ConceptDraw DIAGRAM software with templates, samples, and predesigned libraries of data flow diagram symbols for both notations, allowing you easy design the process-oriented and data-oriented models, draw the Data Flow Diagrams, Data Flowcharts, Data Process Diagrams, Information Flow Diagrams, Structured Analysis Diagrams, etc.Scatter Chart Examples
The Line Graphs solution from Graphs and Charts area of ConceptDraw Solution Park contains a set of examples, templates and design elements library of scatter charts. Use it to draw scatter graphs using ConceptDraw DIAGRAM diagramming and vector drawing software for illustrating your documents, presentations and websites.Information Architecture
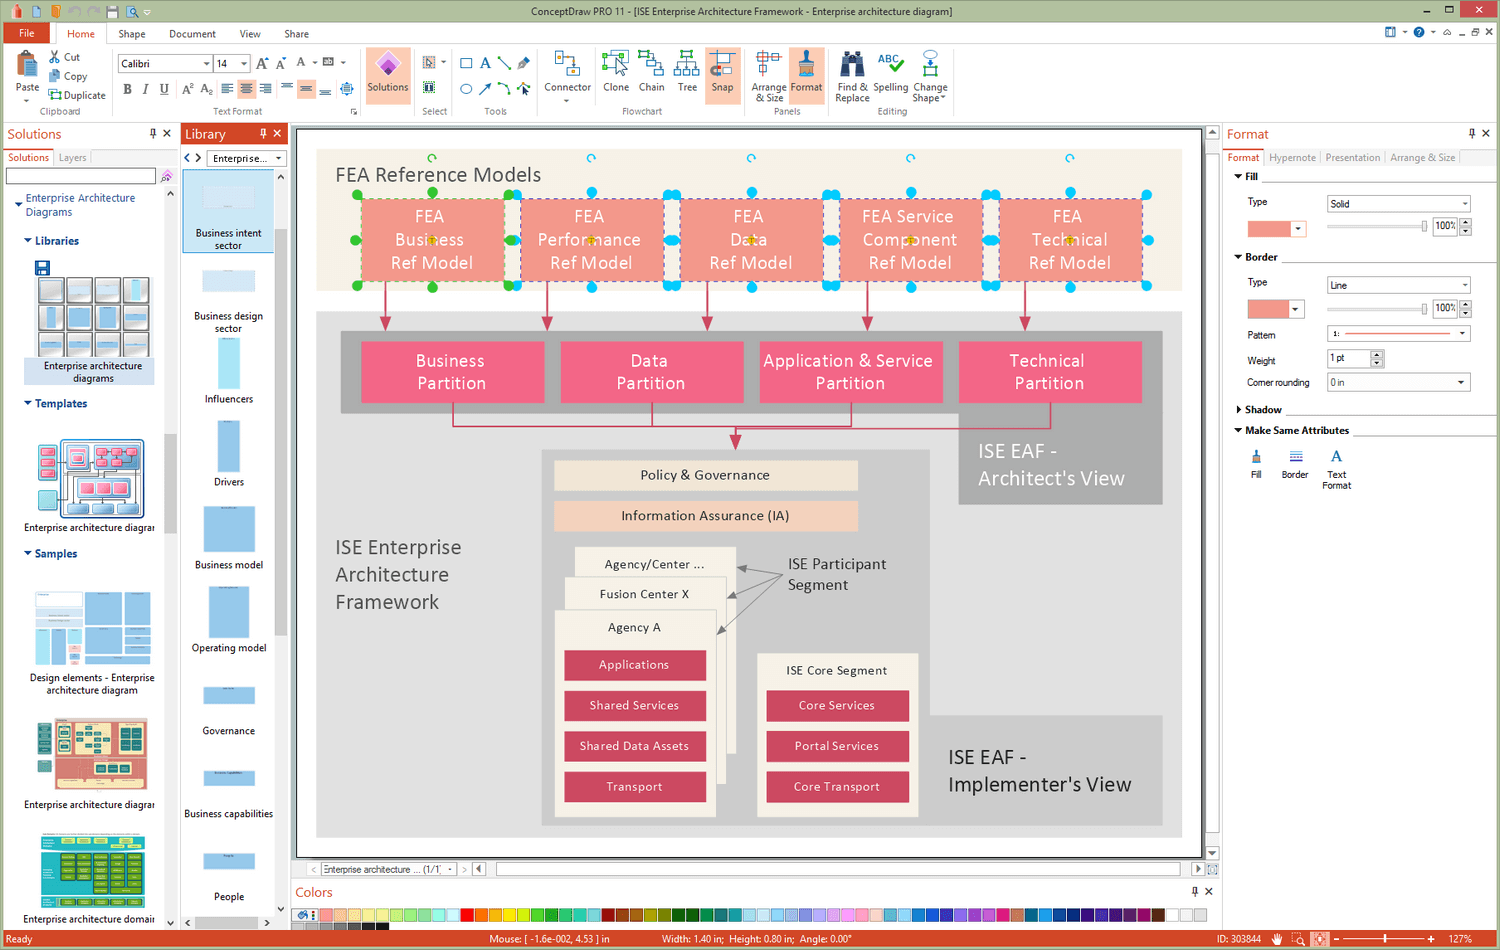
You want design the Information Architecture and need a powerful software for this? ConceptDraw DIAGRAM extended with Enterprise Architecture Diagrams Solution from the Management Area is exactly what you need.- Planogram Software and Retail Plan Software | Planogram | Store ...
- What Is The Components Of Planogram
- What Is Planogram Design
- Planogram Software and Retail Plan Software | Store Layout ...
- Picture This Planogram
- How To Design A Planogram
- What Is Planogram
- Store Layout Software | Planogram | Planogram Software and Retail ...
- Retail Sign Making Templates


