HelpDesk
How to Convert a Mind Map into MS Word Document
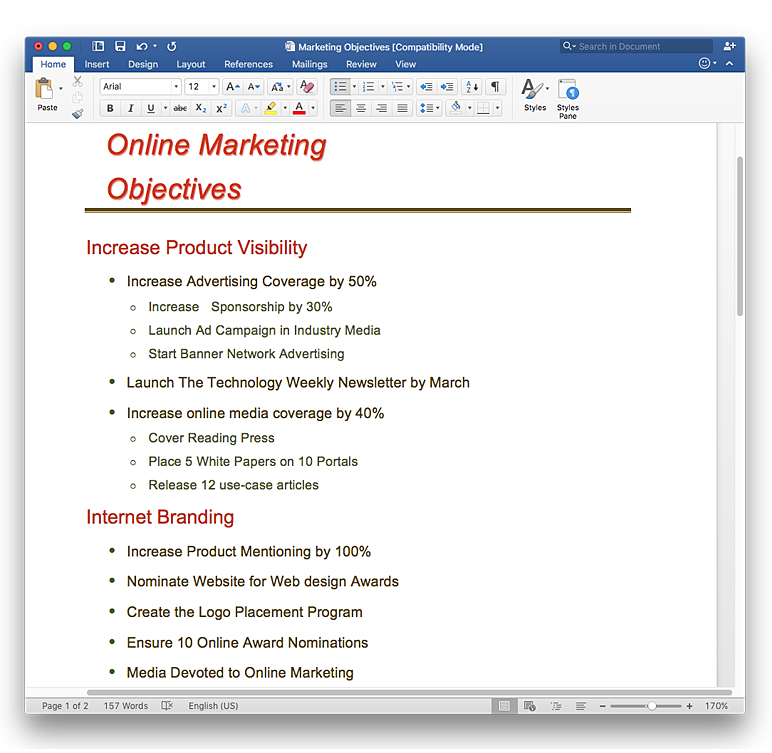
Mind maps are often used for structuring ideas, planning and organizing of various documents. ConceptDraw MINDMAP allows you transfer a mind map to MS Word format using its export facilities. You can convert a mind map to a MS Word outline using the set of standard templates, or even your custom template. Thus, your mind map will be transformed into the proper document format. Using a custom MS Word template allows you apply your individual style to each document, being exported from ConceptDraw MINDMAP. You can use a mind mapping to capture ideas and structure information. Then making a quick conversion to MS Word and you finally obtain a clean and stylish document.Product Overview
ConceptDraw PROJECT is a vigorous tool for managing single or multiple projects. It lets you determine all essential elements involved into project, control schedules, resources and finances, and monitor projects' progress in most effective yet simple manner.
 Circle-Spoke Diagrams
Examples of subject areas that are well suited to this approach are marketing, business, products promotion, process modeling, market, resource, time, and cost analysis. Circle-Spoke Diagrams are successfully used in presentations, conferences, management documents, magazines, reportages, reviews, reports, TV, and social media.
This wheel diagram sample was created on the base of figure illustrating the webpage "Chapter 3: Current State of the Ecosystem" of the website of the National Broadband Plan of US Federal Communications Comission (FCC). "The broadband ecosystem includes applications and content: e-mail, search, news, maps, sales and marketing applications used by businesses, user-generated video and hundreds of thousands of more specialized uses. Ultimately, the value of broadband is realized when it delivers useful applications and content to end-users.
Applications run on devices that attach to the network and allow users to communicate: computers, smartphones, set-top boxes, e-book readers, sensors, private branch exchanges (PBX), local area network routers, modems and an ever-growing list of other devices. New devices mean new opportunities for applications and content.
Finally, broadband networks can take multiple forms: wired or wireless, fixed or mobile, terrestrial or satellite. Different types of networks have different capabilities, benefits and costs.
The value of being connected to the network increases as more people and businesses choose to adopt broadband and use applications and devices that the network supports. Several factors contribute to their decisions. These include whether they can afford a connection, whether they are comfortable with digital technology and whether they believe broadband is useful.
Networks, devices and applications drive each other in a virtuous cycle. If networks are fast, reliable and widely available, companies produce more powerful, more capable devices to connect to those networks. These devices, in turn, encourage innovators and entrepreneurs to develop exciting applications and content. These new applications draw interest among end-users, bring new users online and increase use among those who already subscribe to broadband services. This growth in the broadband ecosystem reinforces the cycle, encouraging service providers to boost the speed, functionality and reach of their networks."
[broadband.gov/ plan/ 3-current-state-of-the-ecosystem/ ]
The circle pie chart example "Forces shaping the broadband ecosystem in the US" was created using the ConceptDraw PRO diagramming and vector drawing software extended with the Target and Circular Diagrams solution from the Marketing area of ConceptDraw Solution Park.
www.conceptdraw.com/ solution-park/ marketing-target-and-circular-diagrams
 Bubble Diagrams
Bubble diagrams have enjoyed great success in software engineering, architecture, economics, medicine, landscape design, scientific and educational process, for ideas organization during brainstorming, for making business illustrations, presentations, planning, design, and strategy development. They are popular because of their simplicity and their powerful visual communication attributes.
 Target and Circular Diagrams
This solution extends ConceptDraw PRO software with samples, templates and library of design elements for drawing the Target and Circular Diagrams.
Target Diagram
Target Diagram is a convenient and visual way of presentation information which is popular and widely used in marketing, business and economics. ConceptDraw PRO diagramming and vector drawing software extended with Target and Circular Diagrams solution from the Marketing area of ConceptDraw Solution Park is ideal for fast and easy drawing a Target Diagram.HelpDesk
How to Draw a Circle-Spoke Diagram Using ConceptDraw PRO
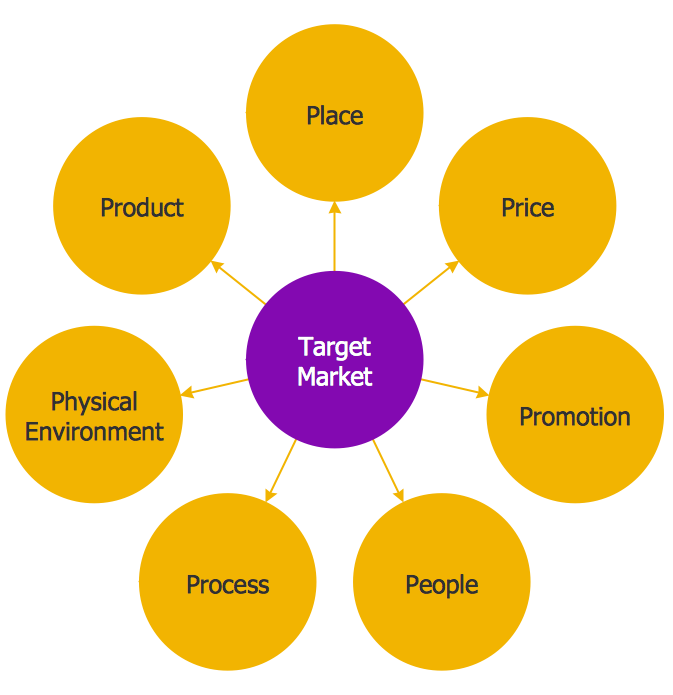
Making circle-spoke diagram is a very useful technique if you want to explore cause and effect. A Circle-Spoke Diagram is a tool that is often used in marketing sphere. Circle-spoke diagram consists from a central circle surrounded in a round arrangement by related sub-circles. They are used to depict the features or components of a central item in a number of areas. Circle-spoke diagram are widely used in marketing and management documents as well as presentations. A Circle-Spoke Diagram is a very useful tool if you want to perform the Cause and Effect analysis. ConceptDraw PRO delivers the ability to make circle-spoke diagrams of various styles with its Circle-Spoke Diagrams solution.- Example Of Wheel Map
- Marketing mix - Wheel diagram | Marketing | Circle-spoke diagram ...
- Marketing mix - Wheel diagram | Target market - Onion diagram ...
- Brand essence model - Wheel diagram | Pyramid Chart Examples ...
- Design elements - Target and circular diagrams | Arrow pie chart ...
- Marketing mix - Wheel diagram | Target market - Onion diagram ...
- Lean Value Stream Map
- Marketing | Marketing mix - Wheel diagram | Marketing Diagrams ...
- Circular Arrows Diagrams | Target and Circular Diagrams | Circular ...
- Target and Circular Diagrams | Target market - Onion diagram ...
- Infographic design elements, software tools Subway and Metro style ...
- Circle-spoke diagram template | Target and Circular Diagrams ...
- Pyramid Chart Examples | Target and Circular Diagrams | Block ...
- Los Angeles county Metro Rail map | How to draw Metro Map style ...
- How to draw Metro Map style infographics? Moscow, New York, Los ...
- Aerospace and Transport | How to draw Metro Map style ...
- Marketing | Marketing Analysis Diagram | Marketing Diagrams ...
- Circle-spoke diagram template - Target market | Arrow circle chart ...
- Marketing mix - Wheel diagram | Target Diagram | Relative Circular ...
- Marketing Diagrams | Marketing | Marketing mix - Wheel diagram ...


