HelpDesk
How to Use a Cross - Functional Flowcharts Solution
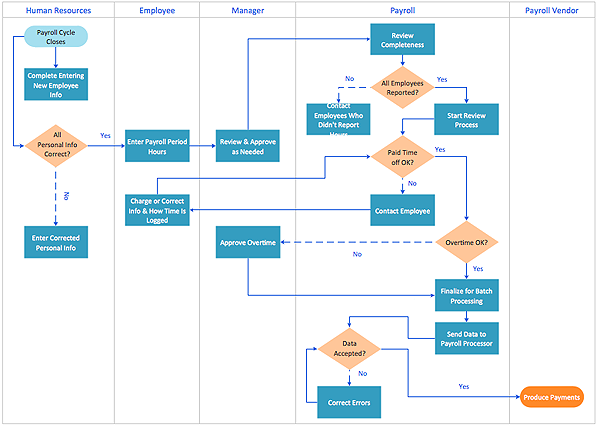
Cross-functional process is a process that involves multiple divisions, each of which makes its part of the entire company workflow. For example: product development, lead management , client orders processing – and other critical processes. Using a Cross-Functional flowchart is a clear way of showing each team member’s responsibilities and how processes get shared or transferred between different teams and departments.The Cross-Functional flowchart is a clear way to visualize the document flow in your organization. The ability to create Cross-functional diagrams is provided by the Cross-Functional Flowcharts solution.
HelpDesk
Event-driven Process Chain (EPC) Diagram Software
An EPC diagram is a type of flowchart used in business process analysis. It shows different business processes through various work flows. The workflows are shown as processes and events that are related to different executes and tasks that allow business workflow to be completed. An EPC diagram shows different business processes through various workflows. The workflows are seen as functions and events that are connected by different teams or people, as well as tasks that allow business processes to be executed. The best thing about this type of enterprise modelling is that creating an EPC diagram is quick and simple as long as you have the proper tool. One of the main usages of the EPC diagrams is in the modelling, analyzing and re-engineering of business processes. With the use of the flowchart, businesses are able to see inefficiencies in the processes and modify to make them more productive. Event-driven process chain diagrams are also used to configure an enterprise resource plaHelpDesk
How to Create an Audit Flowchart Using ConceptDraw PRO
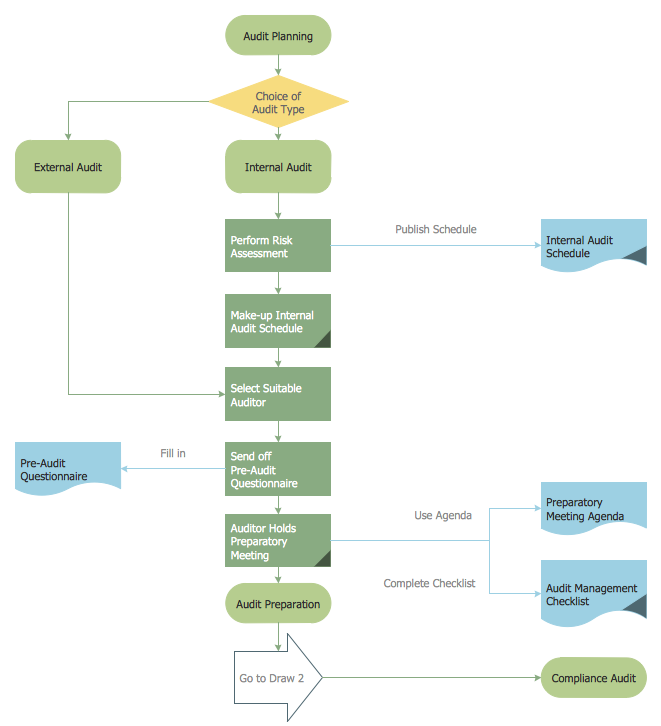
Audit flowcharts are often used in auditors activity. This is the most effective way of preparation and documentation of the audit process. Financial audit process has a clear structure, and therefore audit flowchart is often used to denote an audit process. This is the most effective way of preparation and documentation of the audit process. Flowcharts are often used in auditors activity. A flowchart may be created at any stage of an audit process as an aid in the determination and evaluation of a client's accounting system. ConceptDraw PRO allows you to create professional accounting flowchart quickly using the professional Audit Flowcharts solution.- Basic Flowchart Symbols and Meaning | Accounting Flowchart ...
- Audio and Video Connectors | Basic Flowchart Symbols and ...
- Basic Flowchart Symbols and Meaning | Design elements ...
- Basic Flowchart Symbols and Meaning | Purchase Process Flow ...
- Define Connector In Flowchart
- Basic Flowchart Symbols and Meaning | Accounting Flowchart ...
- Connector Symbol In Flowchart
- Can Flowchart Connectors Cross
- Accounting Flowchart Symbols | Accounting flowcharts - Vector ...
- Connector Description In System Flow Diagram
- Basic Flowchart Symbols and Meaning | Calculate the cost of ...
- Basic Flowchart Symbols and Meaning | ConceptDraw PRO ...
- Basic Flowchart Symbols and Meaning | Accounting flowcharts ...
- Audio Visual Connectors Types | Basic Flowchart Symbols and ...
- Connector Usage In System Flow Diagram
- Describe Connector Flowchart Symbols As Use In Examples
- Connector Symbols In Flowchart
- Basic Flowchart Symbols and Meaning | Database Flowchart ...
- Basic Flowchart Symbols and Meaning | Accounting Flowchart ...
- Cross-Functional Flowchart (Swim Lanes) | Swim Lane Diagrams ...


