LLNL Flow Charts
These flow charts help scientists analysts and other decision makers to visualize the complex interrelationships involved in managing our nation x2019.HelpDesk
How to Create a VSM Diagram Using ConceptDraw Value Stream Mapping Solution
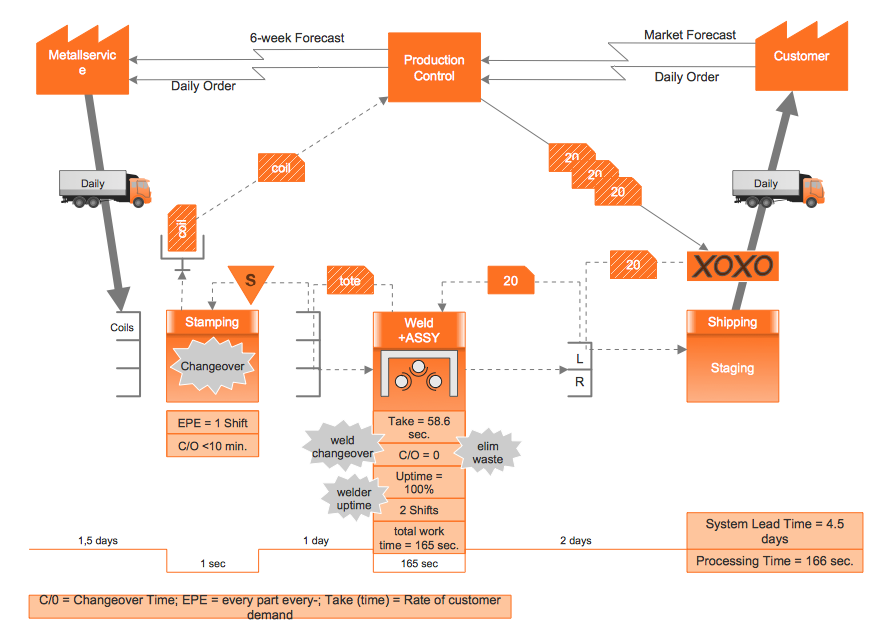
Value Stream Mapping is a Lean Manufacturing tool that uses a flow diagram to document in great detail every step of a manufacturing process. This graphical representation of a process is a powerful tool that helps in the diagnosis of process efficiency and allows companies to develop improved processes. Many lean practitioners use Value Stream Mapping as a fundamental tool to identify waste, cut process cycle times, and implement process improvement. Many organizations use value stream mapping as a key portion of their lean efforts. Value Stream Maps are used to analyze and design the flow of materials and information required to bring a product or service to a consumer. You can create a Value Stream Mapping flowchart using ConceptDraw PRO tools.
 Value Stream Mapping
Value stream mapping solution extends ConceptDraw PRO software with templates, samples and vector stencils for drawing the Value Stream Maps (VSM) in lean manufacturing practice.
 Quality Mind Map
This solution extends ConceptDraw MINDMAP software with Quality Management Mind Maps (Presentations, Meeting Agendas, Problem to be solved).
 Fishbone Diagram
Fishbone Diagrams solution extends ConceptDraw PRO software with templates, samples and library of vector stencils for drawing the Ishikawa diagrams for cause and effect analysis.
- Material Requisition Flowchart . Flowchart Examples | Process ...
- Block diagram - Planning process | Process Flowchart | Project ...
- Types of Flowchart - Overview | Process Flowchart | HR ...
- Flow chart Example. Warehouse Flowchart | Basic Diagramming ...
- Symbols Of Materials Used In Technical Drawing
- Material Requisition Flowchart . Flowchart Examples | Flow chart ...
- Seven Management and Planning Tools | Building Drawing ...
- Process Flowchart | Piping and Instrumentation Diagram Software ...
- Types of Flowchart - Overview | Process Flowchart | HR ...
- Project planning process - Flowchart | Audit flowchart - Project ...
- Process Flowchart | Types of Flowchart - Overview | Audit flowchart ...
- Plant Layout Plans | Process Flowchart | Piping and Instrumentation ...
- Process Flowchart | Plumbing and Piping Plans | Piping and ...
- Material Requisition Flowchart . Flowchart Examples | Value stream ...
- Process Flowchart | How to Create Flowcharts for an Accounting ...
- Audit Flowcharts | Audit Flowchart Symbols | Basic Audit Flowchart ...
- Process Flowchart | Block Diagrams | Cross-Functional Flowchart ...
- Basic Diagramming | Flow chart Example. Warehouse Flowchart ...
- Sales Process Flowchart . Flowchart Examples | Sales Process Steps ...
- Types of Flowchart - Overview | Process Flowchart | Audit flowchart ...
.jpg)
