Flowchart Components

Design Elements for UML Diagrams

What is a Local Area Network? Examples of LAN Diagrams
 diagram")

UML Component Diagram. Design Elements


Entity Relationship Software

E-R Diagrams

Diagramming Software for Design UML Component Diagrams

UML Diagramming Software

 Jackson Structured Programming (JSP) Diagrams
The Jackson Structured Programming (JSP) Diagram solution extends the functionality and drawing abilities of the ConceptDraw DIAGRAM software with set of illustrative JSP diagrams samples and large variety of predesigned vector objects of actions, processes, procedures, selection, iteration, as well as arrows and connectors to join the objects during Jackson structured development and designing Jackson structured programming diagrams, JSP diagram, Jackson structure diagram (JSD), Program structure diagram. The powerful abilities of this solution make the ConceptDraw DIAGRAM ideal assistant for programmers, software developers, structural programmers, computer engineers, applications constructors, designers, specialists in structured programming and Jackson systems design, and other technical, computer and software specialists.
Cause and Effect Diagram Software

 Rapid UML
In order to create any of the described drawings, the ConceptDraw DIAGRAM vector diagramming and drawing software can be used. Having the Rapid UML solution that extends the ConceptDraw DIAGRAM application with the ability to develop the needed UML diagrams within a short period of time, can help you complete the UML-related tasks faster. This solution uses the so-called “ConceptDraw RapidDraw” techniques and it may be useful for many different IT specialists, programmers, software developers, software engineers.
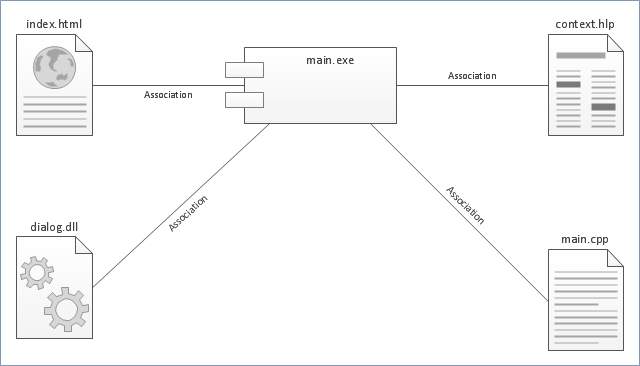
"Component diagram shows components, provided and required interfaces, ports, and relationships between them. This type of diagrams is used in Component-Based Development (CBD) to describe systems with Service-Oriented Architecture (SOA).
Component-based development is based on assumptions that previously constructed components could be reused and that components could be replaced by some other "equivalent" or "conformant" components, if needed.
The artifacts that implement component are intended to be capable of being deployed and re-deployed independently, for instance to update an existing system.
Components in UML could represent:
(1) logical components (e.g., business components, process components), and
(2) physical components (e.g., CORBA components, EJB components, COM+ and .NET components, WSDL components, etc.),
along with the artifacts that implement them and the nodes on which they are deployed and executed. It is anticipated that profiles based around components will be developed for specific component technologies and associated hardware and software environments." [uml-diagrams.org/ component-diagrams.html]
The template "UML component diagram" for the ConceptDraw PRO diagramming and vector drawing software is included in the Rapid UML solution from the Software Development area of ConceptDraw Solution Park.
www.conceptdraw.com/ solution-park/ software-uml
UML component diagram
UML Class Diagram Notation

Entity Relationship Diagram Software for Mac

Technical Flow Chart Example

Data Flow Diagram (DFD)
 *")
Cloud Computing Architecture Diagrams

Components of ER Diagram

Diagramming Software for Design UML Activity Diagrams

System Block Diagram Software

- Local area network (LAN). Computer and Network Examples | Cloud ...
- Flowchart Components | Explain Software With The Aid Of Diagram
- Cloud Computing Architecture Diagrams | Local area network (LAN ...
- Computer Network Diagrams | Telecommunication Network ...
- Computer Network Diagrams | With The Aid Of Diagram Describe ...
- Process Flowchart | Network Diagram Software LAN Network ...
- Computer Network Diagrams | With The Aid Of Diagram Explain The ...
- Process Flowchart | With The Aid Diagram Explain The Various ...
- Computer Network Diagrams | Network Diagramming with ...