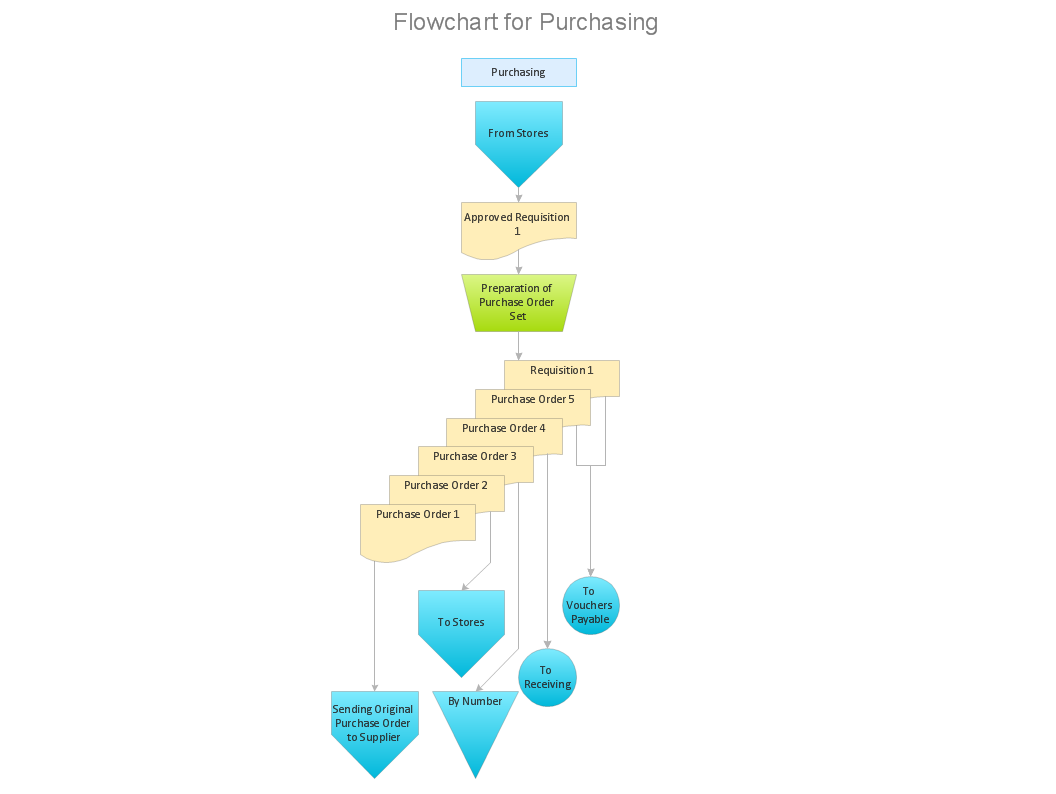
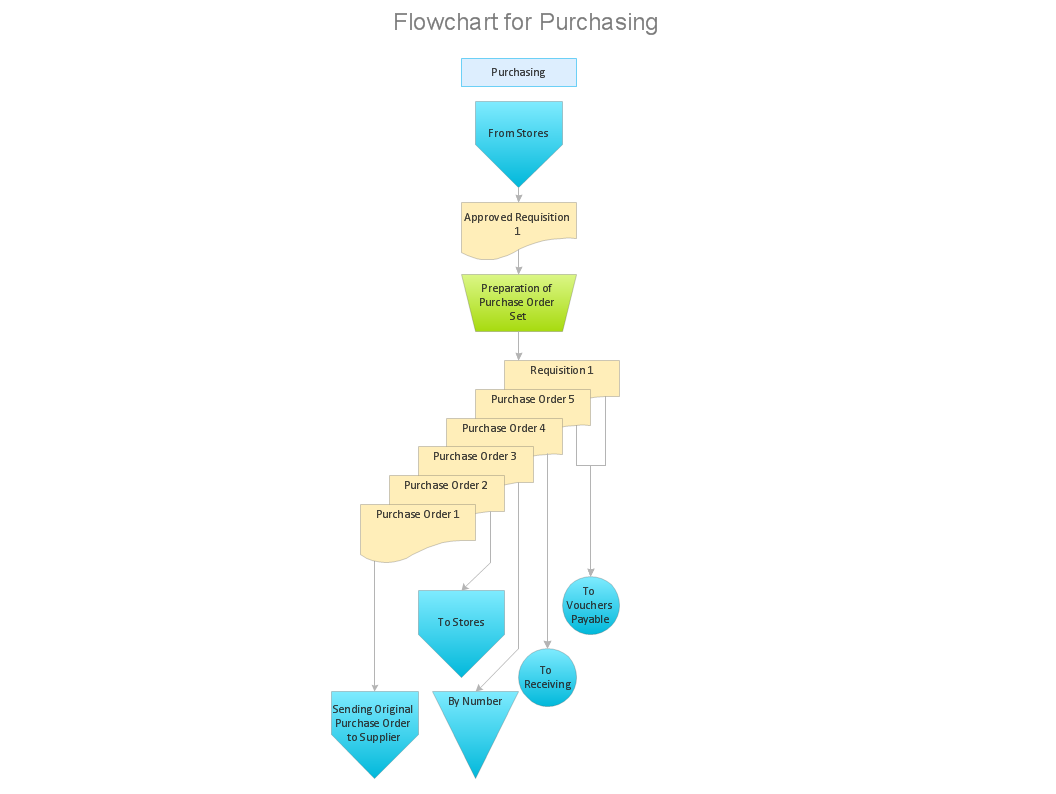
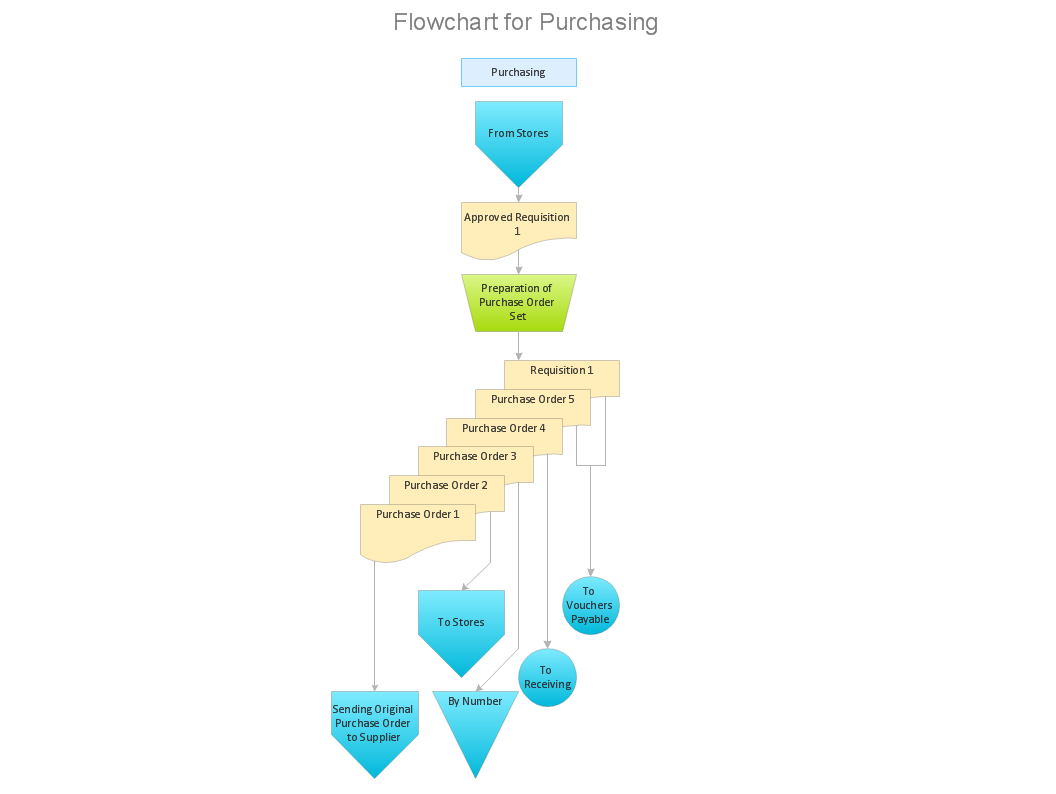
What can go wrong if the purchasing process is not followed?
Make sure that your purchasing process complies with the standards and regulations. Common key elements of purchasing process.How to Draw a Flowchart
A good Flowchart is incredibly helpful for representing and understanding the system and systematic flow of information in the system. That's why its creation requires attention, accuracy, caution and expertise. There are many standardized symbols which can be used in Flowcharts to represent different kinds of steps. The basic flowchart's element is a simple action, which is represented as a box containing description of the action. The flow is shown with arrows between sequential action boxes. The decision is shown as a diamond that contains a simple question to which the answer is 'yes' or 'no' Are you confused on how to draw a Flowchart? ConceptDraw DIAGRAM diagramming and vector drawing software will help you in flowchart drawing due to the included templates, samples and vector objects libraries which are offered in great quantity by Flowcharts solution from Diagrams area. Besides you need clearly and accurately define the process boundaries with starting and ending points, and each step in the process, identify time lags and non-value-adding steps.Using Fishbone Diagrams for Problem Solving
Problems are obstacles and challenges that one should overcome to reach the goal. They are an inseparable part of any business, and the success of an enterprise often depends on ability to solve all problems effectively. The process of problem solving often uses rational approach, helping to find a suitable solution. Using Fishbone Diagrams for Problem Solving is a productive and illustrative tool to identify the most important factors causing the trouble. ConceptDraw DIAGRAM extended with Fishbone Diagrams solution from the Management area of ConceptDraw Solution Park is a powerful tool for problem solving with Fishbone Ishikawa diagram graphic method.Horizontal Flowchart
This sample was created in ConceptDraw DIAGRAM diagramming and vector drawing software using the Flowcharts solution from the Diagrams area of ConceptDraw Solution Park. A Flowchart is a graphically representation of the process, algorithm or the step-by-step solution of the problem. The Flowcharts have one or more starting and ending points. The geometric figures on the Flowcharts represent the steps of the process and are connected with arrows that show the sequence of the actions.8 Step Problem Solving
Time by time the problems appear in any field of our life and activities, and we can't to escape this. Any problem always has a certain content, the reasons and the circle of involved people. But the main task of any human, any organization, any company that was faced with a problem, is not to get lost and vice versa confidently look for the ways of solving this problem. The first you need to clarify the problem's essence, then to breakdown your problem and set a target. The most responsible step is to identify the cause-effect relationship, because each problem has its own root causes, and their detection will allow qualitatively solve this problem and avoid the similar problems in a future. Then you need to develop the countermeasures to counter the root cause of the problem and to make sure in their effectiveness, that they lead to the desired results. And finally standardize successful processes. This Mind Map designed with help of ConceptDraw MINDMAP software represents step-by-step the 8 steps approach of solving any kind of product or service problems.Fishbone Problem Solving
The knowledge and ability to apply various strategies for dealing with problems and difficult situations is very useful in many areas. The Fishbone strategy is one of the most progressive. This graphical technique helps to identify possible causes of problems, to set the goals, and also show internal connections between the different parts of problem. After reviewing all causes and facts, you can easily find right solution. ConceptDraw DIAGRAM diagramming and vector drawing software extended with Fishbone Diagrams Solution from the Management Area of ConceptDraw Solution Park is a powerful Fishbone Problem Solving tool.Basic Flowchart Examples
ConceptDraw DIAGRAM is a business flowchart software includes the wide flowchart examples package.How to Make an Accounting Process Flowchart
Tips on how to make an accounting flowchart. Describing methods and symbols that are used to represent the accounting system.Cross-Functional Flowcharts
The Cross-Functional Flowcharts solution extends ConceptDraw DIAGRAM software with cross functional flowchart examples, samples, and libraries of cross functional flow chart vector design elements and CH-1 symbols for easy drawing professional-looking and illustrative Cross Functional Flowchart, Cross Functional Diagram, CH-1 Diagram, Process Flowchart, Deployment Flowchart, Opportunity Flowchart, Swimlane Process Mapping Diagram, or Visio Cross Functional Flowchart for planning and further analyzing, optimizing and improvement processes. The use of included pre-made cross functional flowchart template, opportunity flowchart template, and swimlane process map template, greatly easier designing your Cross-functional flowcharts.
PDPC
ConceptDraw DIAGRAM extended with Seven Management and Planning Tools Solution from the Management Area of ConceptDraw Solution Park is the best software for drawing all types of diagrams from the Seven Management and Planning Tools: Affinity Diagram, Relations Diagram, Prioritization Matrix, Root Cause Analysis Tree Diagram, Involvement Matrix, PERT Chart, and Risk Diagram (PDPC).Bubble diagrams in Landscape Design with ConceptDraw DIAGRAM
Bubble Diagrams are the charts with a bubble presentation of data with obligatory consideration of bubble's sizes. They are analogs of Mind Maps and find their application at many fields, and even in landscape design. At this case the bubbles are applied to illustrate the arrangement of different areas of future landscape design, such as lawns, flowerbeds, playgrounds, pools, recreation areas, etc. Bubble Diagram helps to see instantly the whole project, it is easy for design and quite informative, in most cases it reflects all needed information. Often Bubble Diagram is used as a draft for the future landscape project, on the first stage of its design, and in case of approval of chosen design concept is created advanced detailed landscape plan with specification of plants and used materials. Creation of Bubble Diagrams for landscape in ConceptDraw DIAGRAM software is an easy task thanks to the Bubble Diagrams solution from "Diagrams" area. You can use the ready scanned location plan as the base or create it easy using the special ConceptDraw libraries and templates.Cross Functional Flowchart
ConceptDraw DIAGRAM extended with Cross-Functional Flowcharts Solution from the Business Processes Area is the best software for quick and easy designing Cross Functional Flowchart of any complexity. Make sure in it right now!Why flowchart is important to accounting information system?
Flowcharts are used to represent accounting information in a system. There are special symbols which are used to create accounting flowcharts.Modelling Complex Events with Event-Driven Process chain
Event-Driven Process Chain Diagrams for improvement throughout an organisation. ConceptDraw DIAGRAM - software that reduces the time needed to create a business process model.Decision Making
The Decision Making solution offers the set of professionally developed examples, powerful drawing tools and a wide range of libraries with specific ready-made vector decision icons, decision pictograms, decision flowchart elements, decision tree icons, decision signs arrows, and callouts, allowing the decision maker (even without drawing and design skills) to easily construct Decision diagrams, Business decision maps, Decision flowcharts, Decision trees, Decision matrix, T Chart, Influence diagrams, which are powerful in questions of decision making, holding decision tree analysis and Analytic Hierarchy Process (AHP), visual decomposition the decision problem into hierarchy of easily comprehensible sub-problems and solving them without any efforts.
Risk Diagram (Process Decision Program Chart)
The Risk Diagram or Process Decision Program Chart (PDPC) is intended to determine the risks of potential obstacles during the corrective actions that can be at the cases of their incorrect performing, and helps to develop effective preventive actions. Process Decision Program Chart it's kind of contingency plan to limit the risks, it determines the consequential impacts of failures on the activity plans. The Risk Plans and Process Decision Program Charts can be extended on several levels and take the form of tree or hierarchy, this form is incredibly convenient for representing the risks and countermeasures. ConceptDraw MINDMAP is powerful software tool for Business, Marketing and Project Management. It is also ideal for easy designing MINDMAP Risk Diagram or Process Decision Program Chart, due to the included "7 Management and Planning Tools" solution to ConceptDraw Solution Park. We recommend to start with Process Decision Program Chart (PDPC) template opening it from ConceptDraw STORE or from the Output tab at ConceptDraw MINDMAP application.Making Dashboards Useful Again. Part 0.
Have you ever used dashboards? You probably have, and not just once. Speedometer, tachometer, fuel and oil level indicators, clock, and GPS – this is a typical set of instrumentation that can be found on a car dashboard. Even though all of these indicators are present, an experienced driver feels the speed and engine rpm with sufficient accuracy without looking at the dashboard consistently. The dashboard is an important tool in the car, but not necessarily an irreplaceable one: we need all these indicators to be available while driving, but for 99% of the time they are superfluous. Flowchart Symbols AccountingActivity-based costing (ABC) flowchart
The Accounting Flowcharts are helpful and popular kind of flowcharts in a field of business, finance and accounting. The ConceptDraw DIAGRAM diagramming software enhanced with Accounting Flowcharts solution from the Finance and Accounting area of ConceptDraw Solution Park is extremely comfortable for visually explaining the accounting processes and for designing Accounting Flowcharts and Accounting Process Flow Diagrams of any complexity. The library of vector design elements included to Accounting Flowcharts solution provides you with major accounting flowchart symbols, which make the drawing process incredibly easy and convenient. The use of them for designing of such sort of Accounting Flowcharts as the Activity-based costing (ABC) flowcharts will simplify the drawing process and will allow to make these flowcharts in a few minutes in ConceptDraw DIAGRAM. Design easily your own ABC flowcharts to demonstrate in details the relations and logics of activity-based distribution the costs between the company's units and departments.
SWOT Matrix Software
The SWOT Analysis solution from the Management area of ConceptDraw Solution Park contains set of examples, templates and vector design elements of SWOT and TOWS matrices. It helps you to quickly draw SWOT and TOWS analysis matrix diagrams using the best SWOT matrix software ConceptDraw DIAGRAM.This cause and effect diagram sample was redesigned from the Wikimedia Commons file: Fishbone BadCoffeeExample.jpg. [commons.wikimedia.org/ wiki/ File:Fishbone_ BadCoffeeExample.jpg]
This file is licensed under the Creative Commons Attribution-Share Alike 3.0 Unported license. [creativecommons.org/ licenses/ by-sa/ 3.0/ deed.en]
The fishbone diagram example "Bad coffee" was created using the ConceptDraw PRO diagramming and vector drawing software extended with the Fishbone Diagrams solution from the Management area of ConceptDraw Solution Park.
- Business Process Flowchart Symbols | Business Process Mapping ...
- What can go wrong if the purchasing process is not followed ...
- Venn Diagram Examples for Problem Solving. Environmental Social ...
- Purchase Process Flow Chart , Receiving Process Flow Chart ...
- Venn Diagram Examples for Problem Solving. Environmental Social ...
- Purchase Process Flow Chart , Receiving Process Flow Chart ...
- Venn Diagram Examples for Problem Solving. Environmental Social ...
- Purchase Process Flow Chart , Receiving Process Flow Chart ...
- Problem solving | Fishbone Diagram Problem Solving | Using ...