HelpDesk
How to Draw a Line Chart Quickly
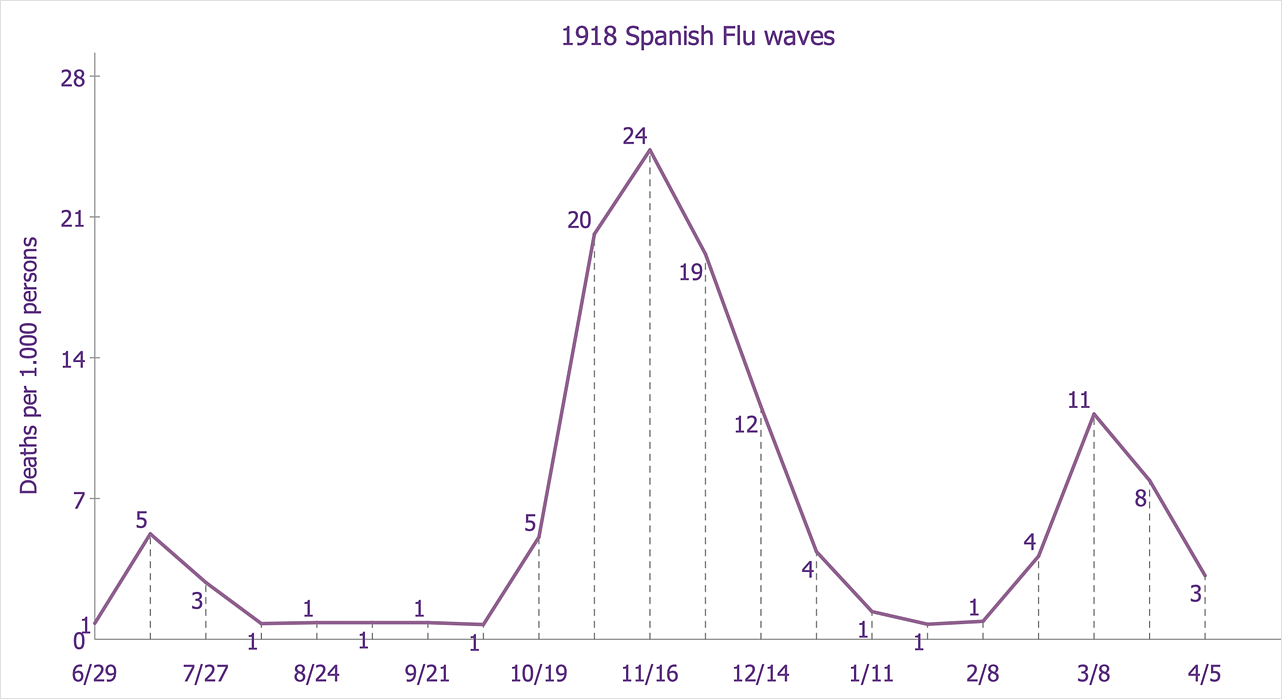
A common line chart is a graphical representation of the functional relationship between two series of data. A line chart that is created by connecting a series of data points together with a straight line is the most basic type of a line chart. A line chart can be used for depicting data that changes continuously over time. It is extensively utilized in statistics, marketing, and financial business. ConceptDraw Basic Line Graph solution provides the possibility to make 2D line charts quickly and effortlessly.HelpDesk
How to Draw Geometric Shapes
Knowledge of geometry grants people good logic, abstract and spatial thinking skills. The object of study of geometry is the size, shape and position, the 2-dimensional and 3-dimensional shapes. Geometry is related to many other areas in math and is used daily by engineers, architects, designers, and many other professionals. Today, the objects of geometry are not only shapes and solids. It deals with properties and relationships and looks much more about analysis and reasoning. Geometry drawings can be helpful when you study geometry or need to illustrate some investigation related to geometry. ConceptDraw DIAGRAM allows you to draw plane and solid geometry shapes quickly and easily.HelpDesk
How to Draw Chemistry Structures
Making chemistry drawings for science and education purposes involves many different elements that can be managed using ConceptDraw DIAGRAM. ConceptDraw Chemistry solution can be used as a tool for creating chemical schemes and diagrams of chemical lab set-ups and labware, formulas, reaction schemes, and molecular structures. With ConceptDraw DIAGRAM you can easily create and communicate chemistry drawings of any complexity.HelpDesk
How to Draw a Process Flow Diagram
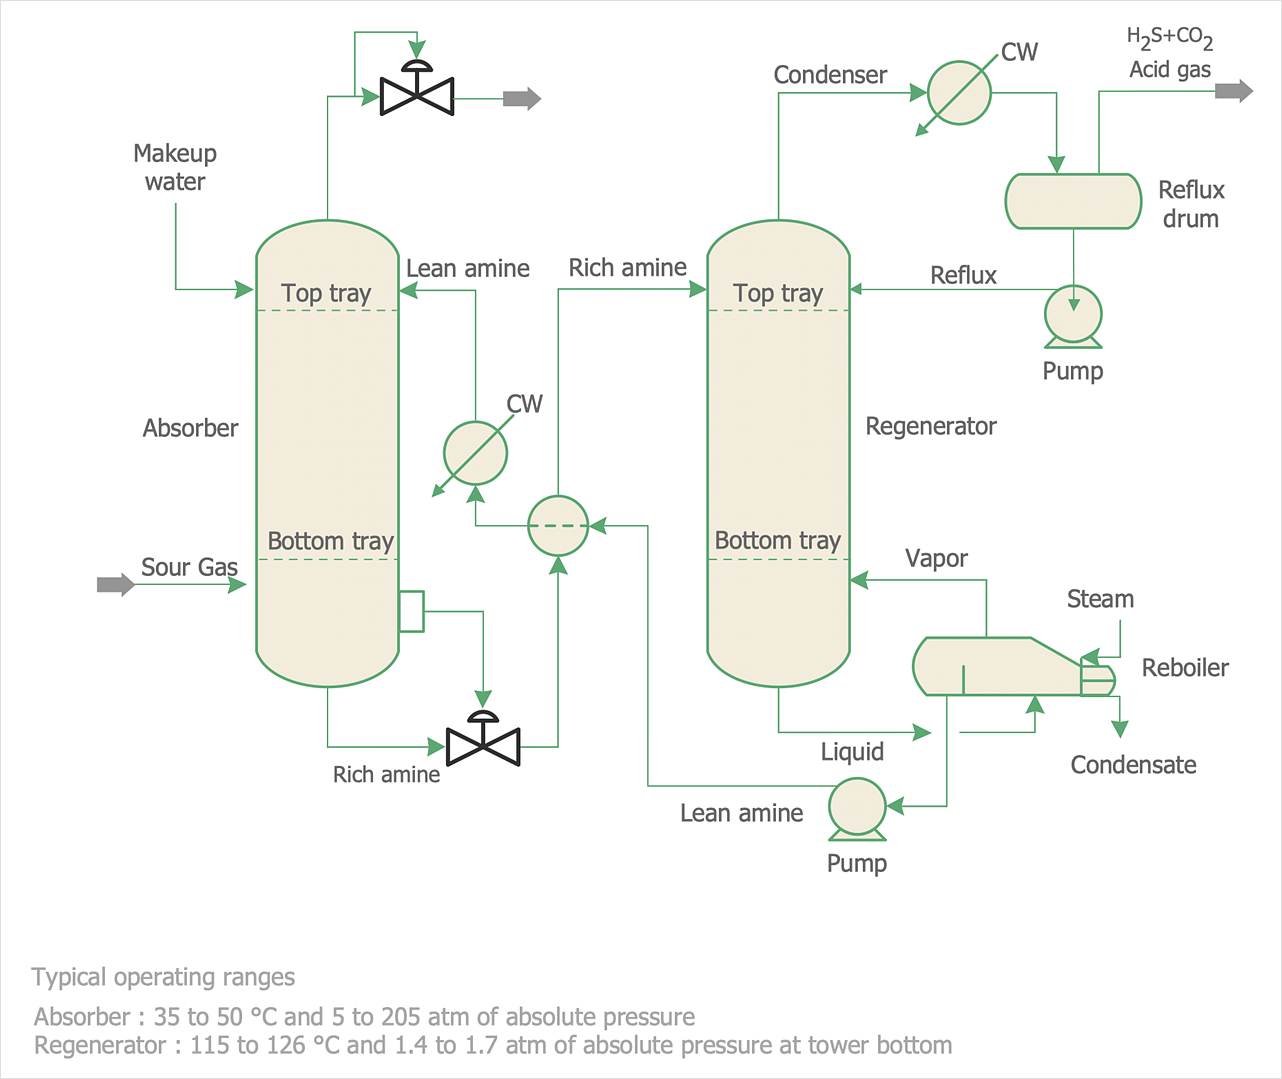
Process Flow diagrams are used in chemical and process engineering to show the flow of chemicals and the equipment involved in the process. When it comes to creating a process flow diagram, it's important to use software that is capable of describing a wide range of processes, using techniques and graphical notation that are easily recognized by engineering workers. An ideal drawing platform will utilize functions that can cope with the output of a high volume of engineering processes, that may change rapidly from development to implementation stages. ConceptDraw DIAGRAM , with the extended functionality of the Chemical and Process Engineering Diagrams solution, is the ideal medium for creating designs of this type. The Chemical and Process Engineering Diagrams solution complements this feature with a library of selected icons to represent various steps — all instantly recognizable and applicable to a wide user base. ConceptDraw DIAGRAM allows you to draw the Process Flow diagram easily using the set of special libraries.Best Program to Make Diagrams
Make diagrams, charts, workflows, flowcharts, org charts, project charts easily with ConceptDraw software.
HelpDesk
How to Draw a Circle-Spoke Diagram
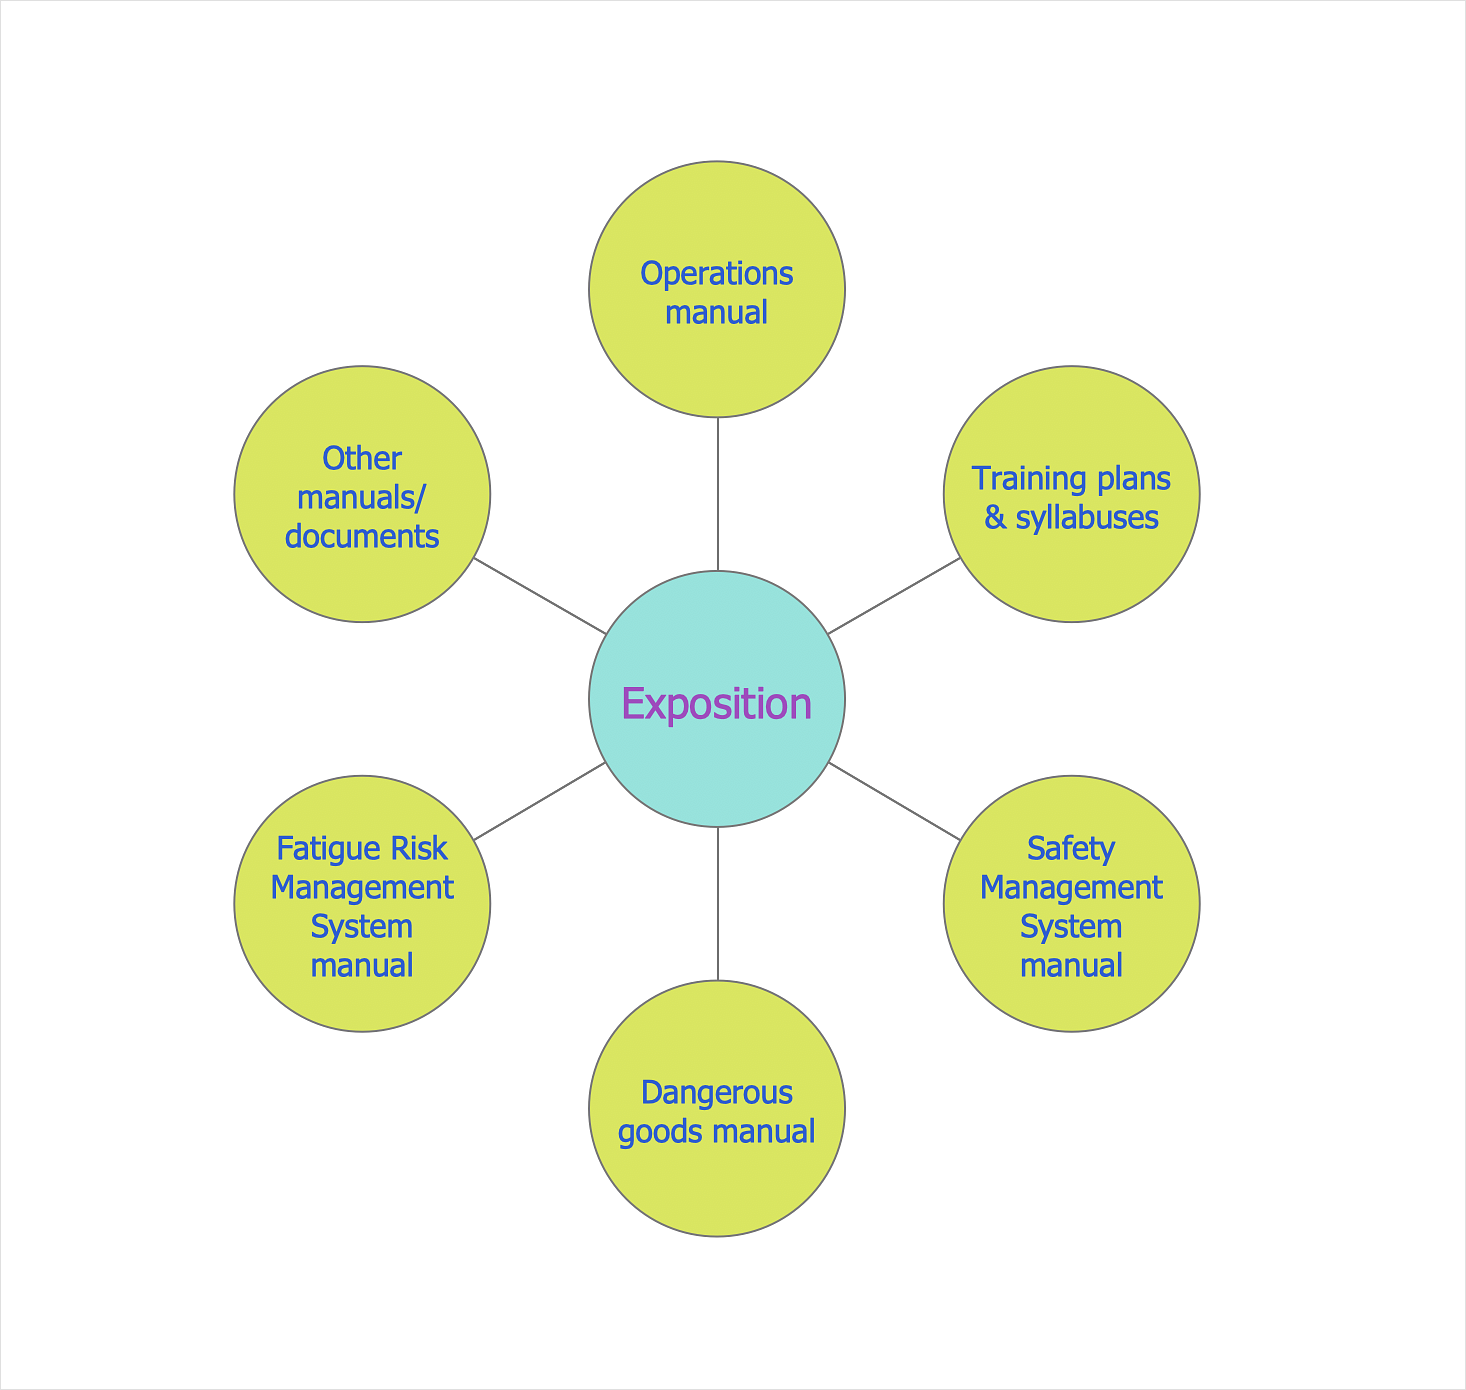
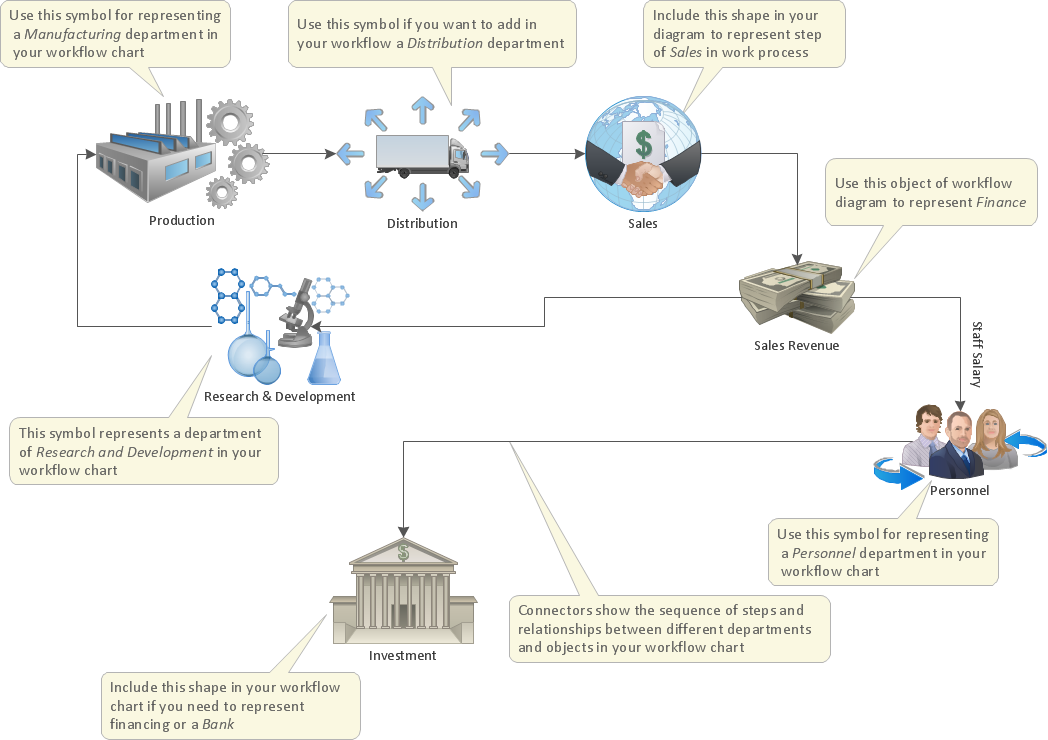
Making circle-spoke diagram is a very useful technique if you want to explore cause and effect. A Circle-Spoke Diagram is a tool that is often used in the marketing sphere. Circle-spoke diagram consists of a central circle surrounded in a round arrangement by related sub-circles. They are used to depict the features or components of a central item in a number of areas. Circle-spoke diagram is widely used in marketing and management documents as well as presentations. A Circle-Spoke Diagram is a very useful tool if you want to perform the Cause and Effect analysis. ConceptDraw DIAGRAM delivers the ability to make circle-spoke diagrams of various styles with its Circle-Spoke Diagrams solution.How to Draw a Good Diagram of a Business Workflow?
To draw a good diagram of a business workflow you should have a ready-to-use set of pre-designed objects you may drag-and-drop to your document focusing on the workflow structure and meaning, not drawing tools. ConceptDraw DIAGRAM with Workflow Diagrams solution provides complete set of design element you may use to draw a good diagram of a business workflow.The Best Drawing Program for Mac
ConceptDraw DIAGRAM is the professional business graphic software for drawing diagrams and charts with great visual appeal on Mac OS X.HelpDesk
How to Change the Measurement Units and Drawing Scale
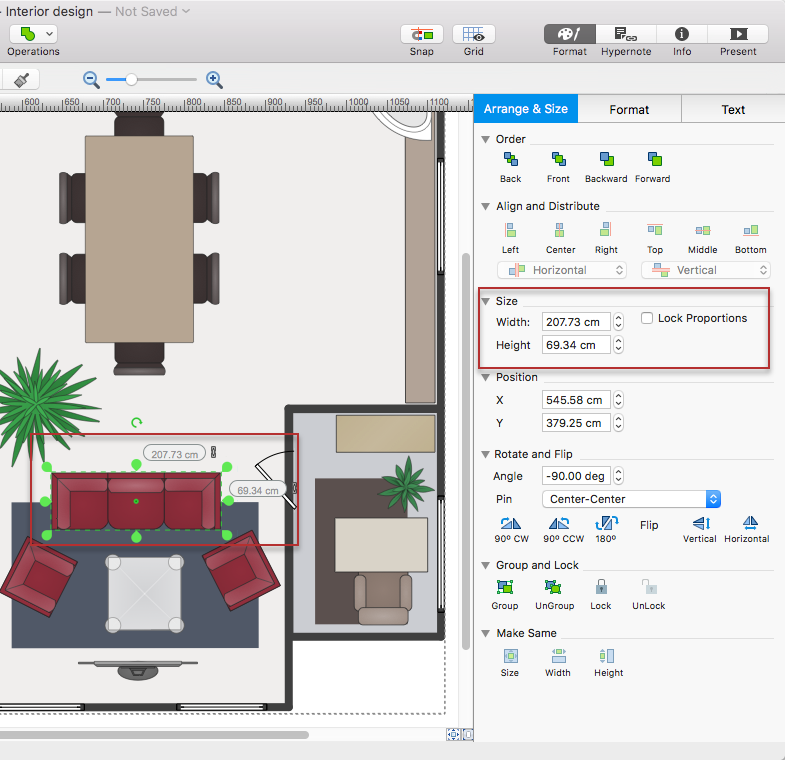
ConceptDraw DIAGRAM allows you to work with drawings with many different measurement units.HelpDesk
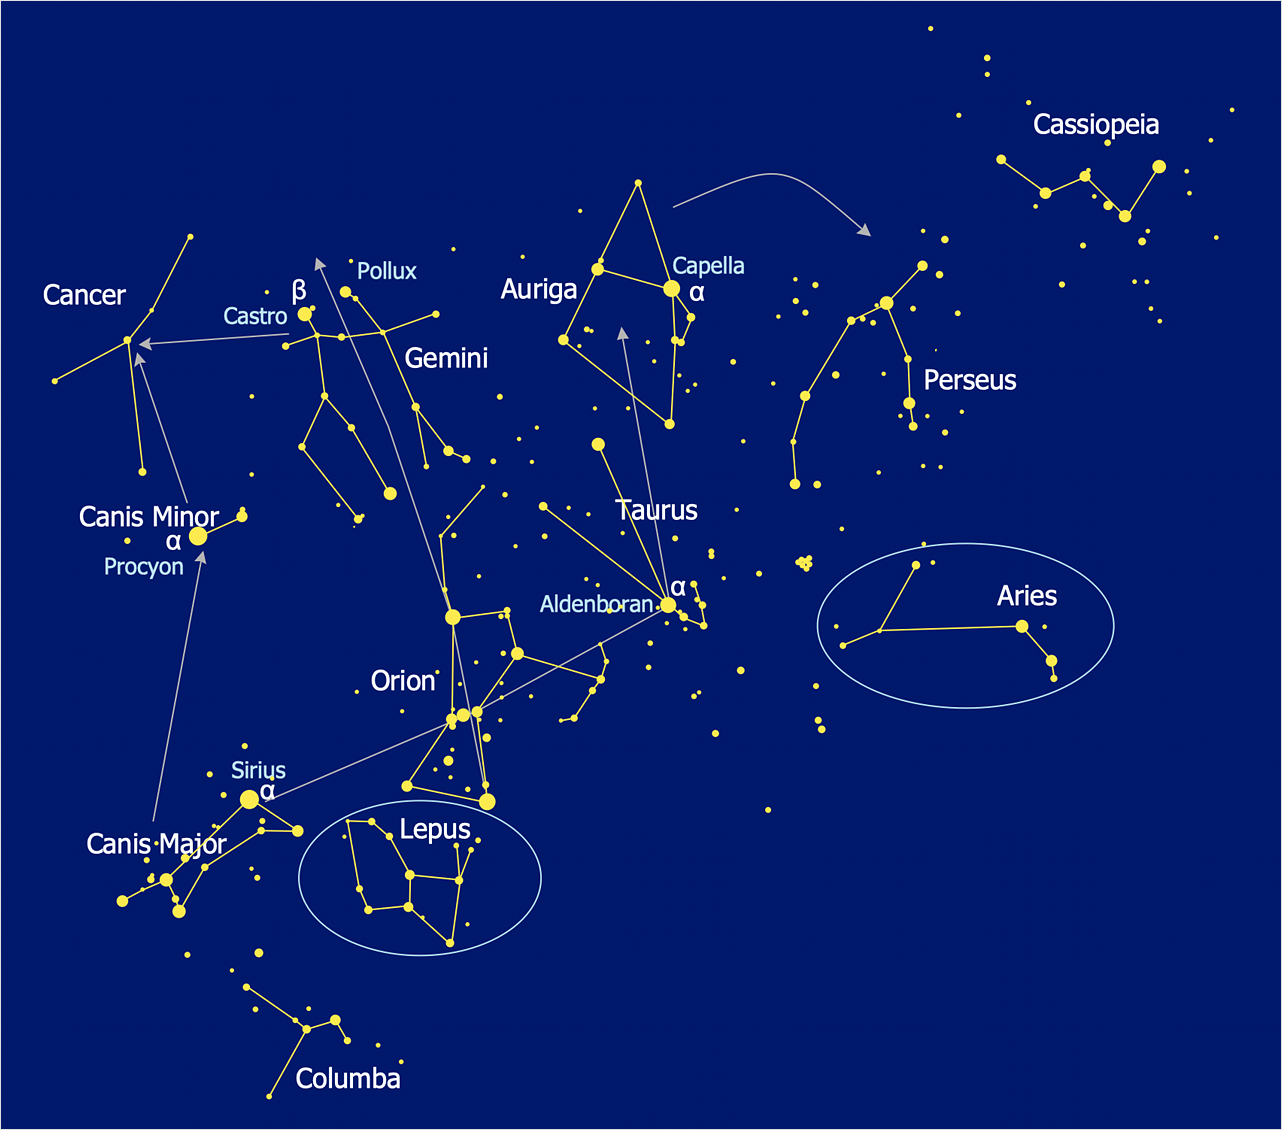
How to Draw a Сonstellation Сhart
Astronomic maps are used to locate stars, planets and other objects in the sky for a certain date, time and observing location. ConceptDraw Astronomy solution can be used as a tool for creating astronomy maps, charts and illustrations that contains astronomy symbols of constellations, galaxies, stars and planets. It allows you to draw the map of any constellation quickly and easily using the special templates and vector stencils libraries.HelpDesk
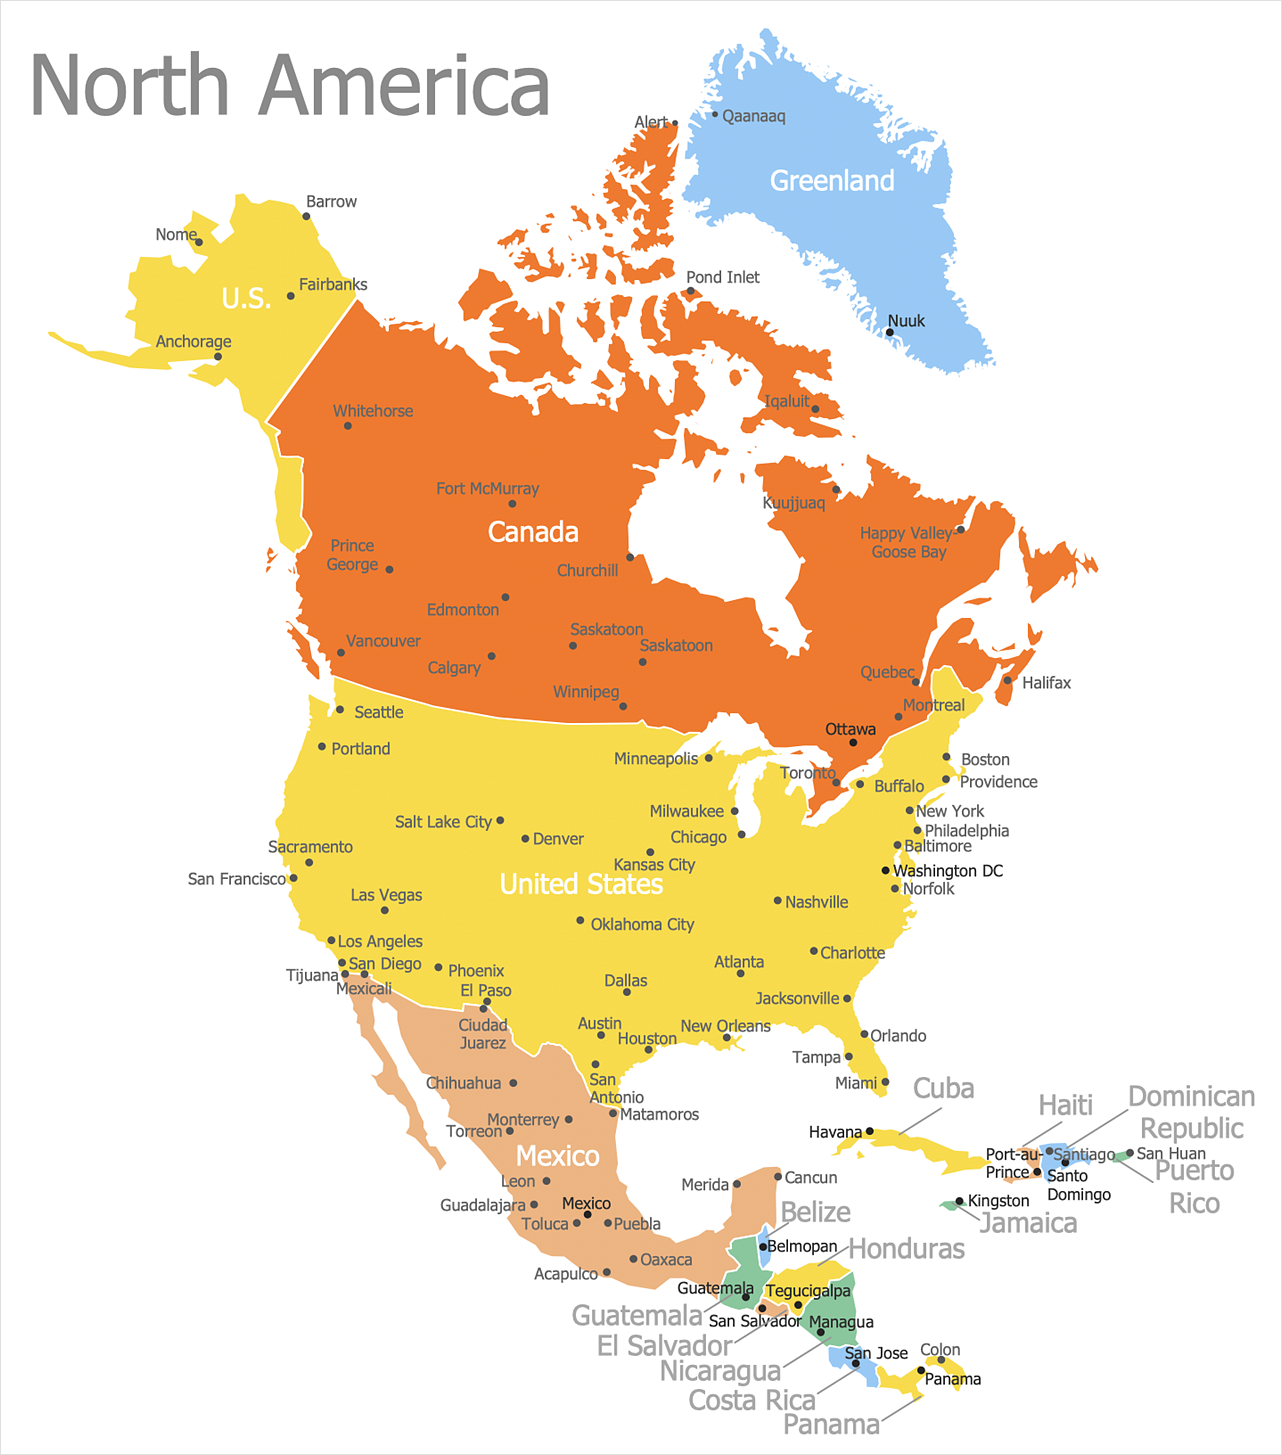
How to Draw a Map of North America
Geographic maps, cardiograms, and thematic maps are often used for geographical visualization of business information. Any country can inspire a wealth of geopolitical statistical data. A common way of assimilating this data is to create maps that convey a particular theme or subject matter in relation to a specific geographical area. Known as thematic maps, they cover themes such as population density, average rainfall, or political allegiance, differentiating the data by using graphical elements and annotation. Thematic maps contrast general reference maps, which tend to display information on a variety of subjects — vegetation, topology, roads, and highways, for example. A thematic map will always focus on one particular subject matter. ConceptDraw DIAGRAM can be helpful as a tool for creating maps of countries and regions of the world. It allows you to draw continental maps quickly and easily using the special templates and vector stencils libraries.How to Draw an Effective Workflow
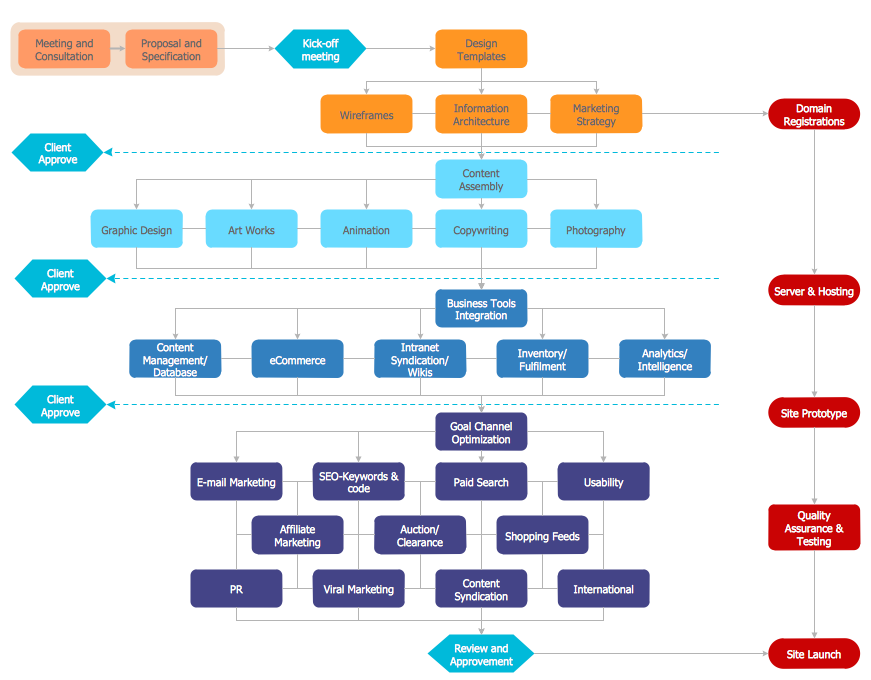
To draw an effective workflow you have to have an ability to focus on thinking, not drawing. This becomes possible with ConceptDraw DIAGRAM software. Thanks to Arrows10 technology, you are able to place steps and relations onto your workflow diagram without thinking of how to do this, or which stencil to use. This is the most natural and effective way of drawing workflows.How to Draw ER Diagrams
An Entity Relationship (ER) Diagram is a type of flowchart that illustrates the logical structure of databases, how the different entities, such as people, objects or concepts relate to each other within a given system. How to draw ER Diagrams fast and easy? ConceptDraw DIAGRAM diagramming and vector drawing software enhanced with Entity-Relationship Diagram (ERD) solution from Software Development area of ConceptDraw Solution Park offers you the powerful abilities of designing the ER Diagrams and ERD drawings without efforts. This solution includes a lot of predesigned icons advocated by popular Chen's and Crow’s Foot notations, which can be used when describing an enterprise database and depicting it by abstract way. Simply drag the required objects to ConceptDraw document, connect them in a desired way and make style settings. But the easiest and fastest way of drawing ERDs is to make them on the base of ready-to-use Chen ERD and Crow's Foot ERD templates, which are both represented at ConceptDraw STORE.HelpDesk
How to Make a Rapid Draw Object
The Rapid Draw technology is an automatic drawing system. It is designed to significantly reduce the time of creating flowcharts and diagrams. Especially those, consisting from some typical entities. You can extend the standard ConceptDraw DIAGRAM object libraries with new objects by customizing any item from any library and assigning it with Rapid Draw features. You can quickly create and edit complex drawings using Rapid Draw technology and your self-created objects.HelpDesk
How to Draw a Pareto Chart
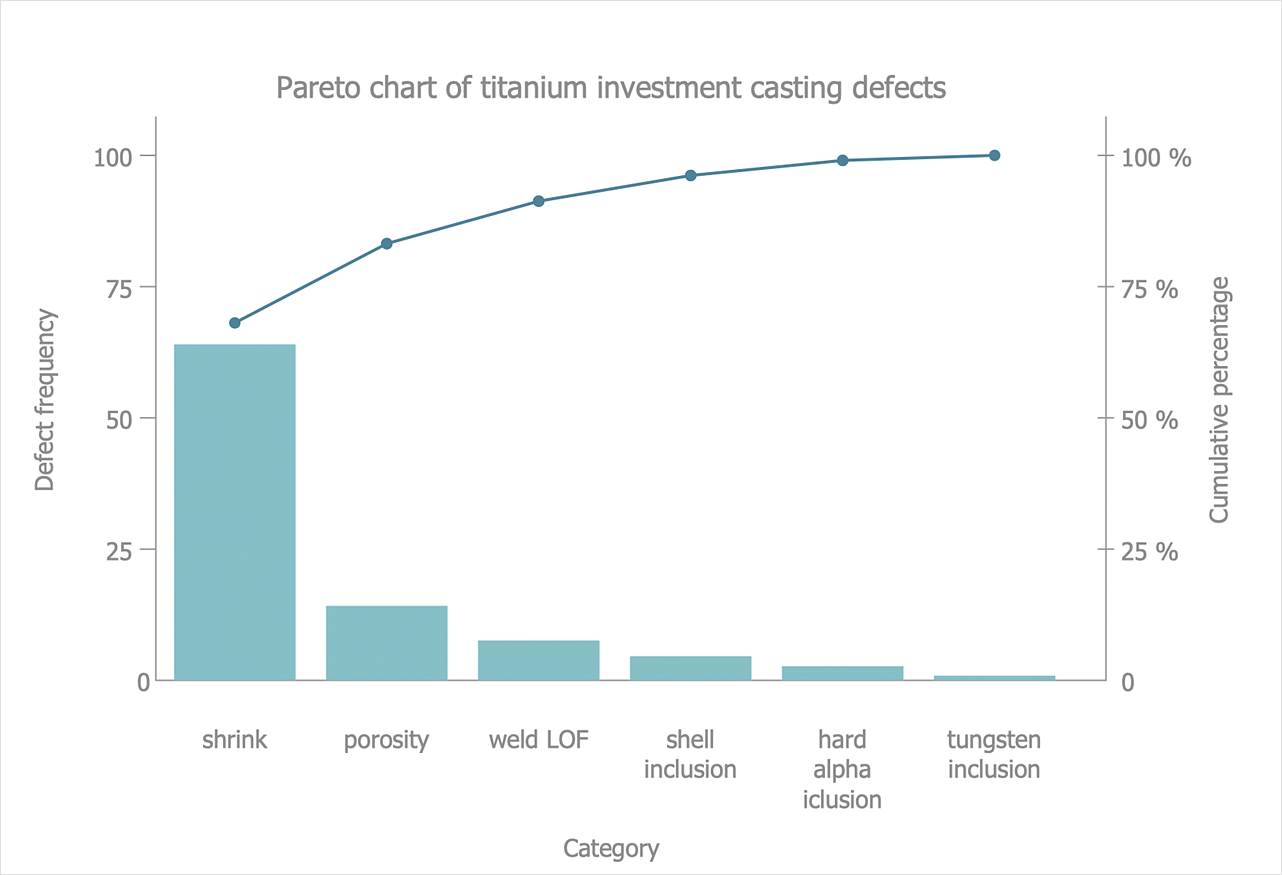
The Seven Basic Tools of Quality were picked as effective visual tool-set for identifying the root cause of quality-related problems within the workplace. Seven Basic Tools of Quality comprise of seven diagrams that are diverse enough to be used to any business troubleshooting scenario, but simple enough that employees of all types can understand and apply them. One of these tools is a Pareto chart. It combines both a line graph and a bar chart, where the bar chart displays data values, and a line represents a total value. Pareto chart is used for quality control to identify the source of the quality problem. ConceptDraw Seven Basic Tools of Quality solution delivers a big set of vector stencil libraries and samples for each quality control diagram, including a Pareto chart.How to Draw an Organization Chart
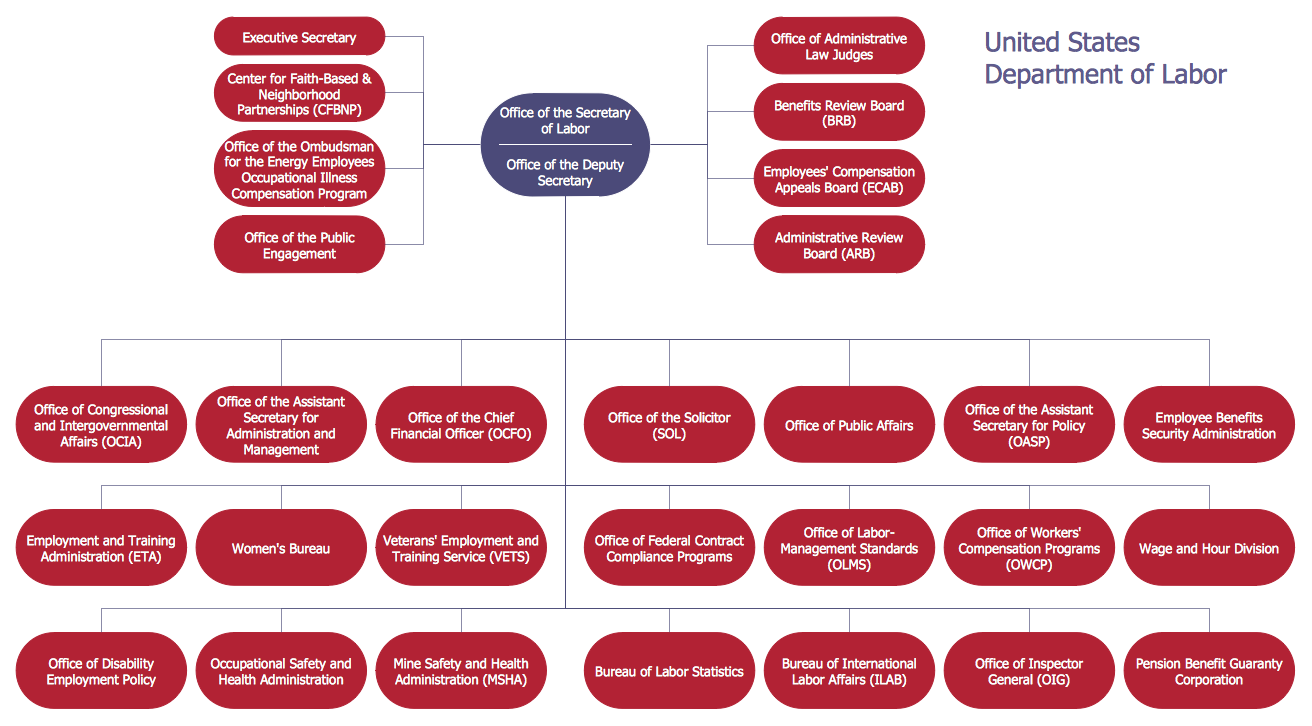
An Organizational chart is a type of diagram which visually displays the structure of an organization, relationships and relative ranks of the organization′s parts and positions. Organizational chart is constructed as an hierarchical structure, in the form of tree. How to Draw an Organization Chart the most easy and quickly? The Organizational Charts solution, innovative Tree Auto-connection mode and ConceptDraw Arrows10 Technology included in ConceptDraw DIAGRAM software are powerful drawing tools that change the way of diagrams production. Arrows10 Technology provides smart behavior for the connectors, and so quick and precise placement when drawing, and lets easy make the changes and automatic rearrangement. It helps to make the process of drawing diagrams more efficient, easier and faster. Now, you don′t need to think on how to connect or place the objects, you can concentrate fully on what to draw. See obligatory the helpful video tutorial about creation the Organization Charts and orgchart professional presentations with ConceptDraw products.Basic Diagramming
Try ConceptDraw program, the perfect drawing tool for creating all kinds of great-looking drawings, charts, graphs, and illustrations.
Network Diagramming with ConceptDraw DIAGRAM
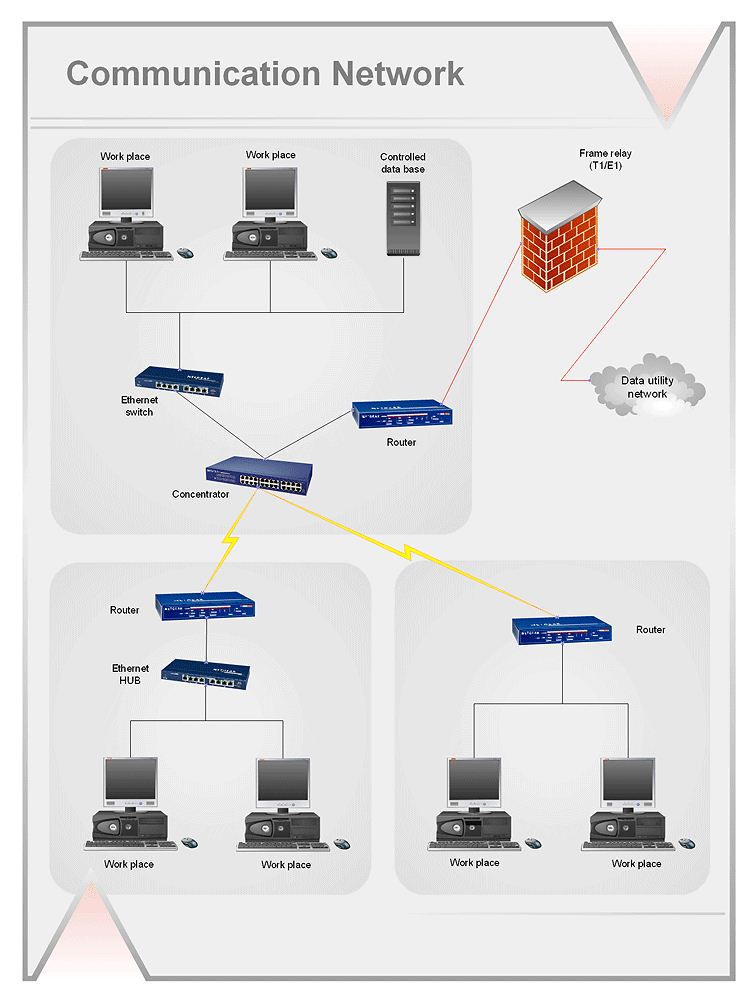
At the moment computer networks are widespread, various types of computer networks are constructed around the world, operate and interact with each other. There are many kinds of computer networks that differ in the transmission medium, in communications protocols, in size, topology, organizational intent, and also in territorial basis. There are popular such types of computer networks as Global Area Network (GAN), Wide Area Network (WAN), Metropolitan Area Network (MAN), Local Area Network (LAN). ConceptDraw DIAGRAM is a powerful network diagramming software, perfect for software engineers, software designers and software developers who need to draw Computer Network diagrams, designs, schematics, and network maps in no time. The pre-drawn shapes representing computers, network devices and smart connectors offered by ConceptDraw solutions help to create the accurate diagrams and documentation, represent computer network topologies and designs, depict Computer network architectures, logical, physical, cable networks, and vehicular networks.Draw Company Structure with Organization Charting Software
Draw Company Structure Diagram - get the detailed information about the company structure and hierarchy - who execute what tasks and who is in charge at this company. This information shows the reasoning and success of business and is indispensable for investors and financial institutions.
Best Vector Drawing Application for Mac OS X
ConceptDraw DIAGRAM creates drawings, diagrams and charts with great visual appeal in Mac OS X.- Www Draw Organisation Chart Describe The Flowchart Of
- Mechanical Engineering | Mechanical Drawing Symbols ...
- Sport Field Plans | Www Draw Football Ground Area Com
- Electrical Symbols — Resistors | Www Draw The Variable Resistor
- Draw A Sketch Of System Development Cycle
- How to Draw an Organizational Chart Using ConceptDraw PRO ...
- Www Draw 4 Telecom Com
- Drawing Illustration | Draw Flowcharts with ConceptDraw | Business ...
- Www Draw Awell Level Computer Diagram And Pheriperial Device ...
- Www Draw Up A Flow Chart That Give The Sequence Of
- Pyramid Diagram | Www Draw A Triangle With Five Levels
- Solving quadratic equation algorithm - Flowchart | Basic Network ...
- Matrix Organization Structure | How to Draw an Organization Chart ...
- HR Flowchart Symbols | Orgchart | 25 Typical Orgcharts | Www Draw ...
- Www Draw And Organogram Of Pualic Library
- Www Draw A Pyramid Of Communication And Lebel It
- Www Draw Of Cooker Control Unit
- Process Flowchart | How to Draw a Computer Network Diagrams ...
- Organogram Software | Pyramid Diagram | How to Draw an ...
- Cross-Functional Flowchart | Mechanical Engineering | Electrical ...
