HelpDesk
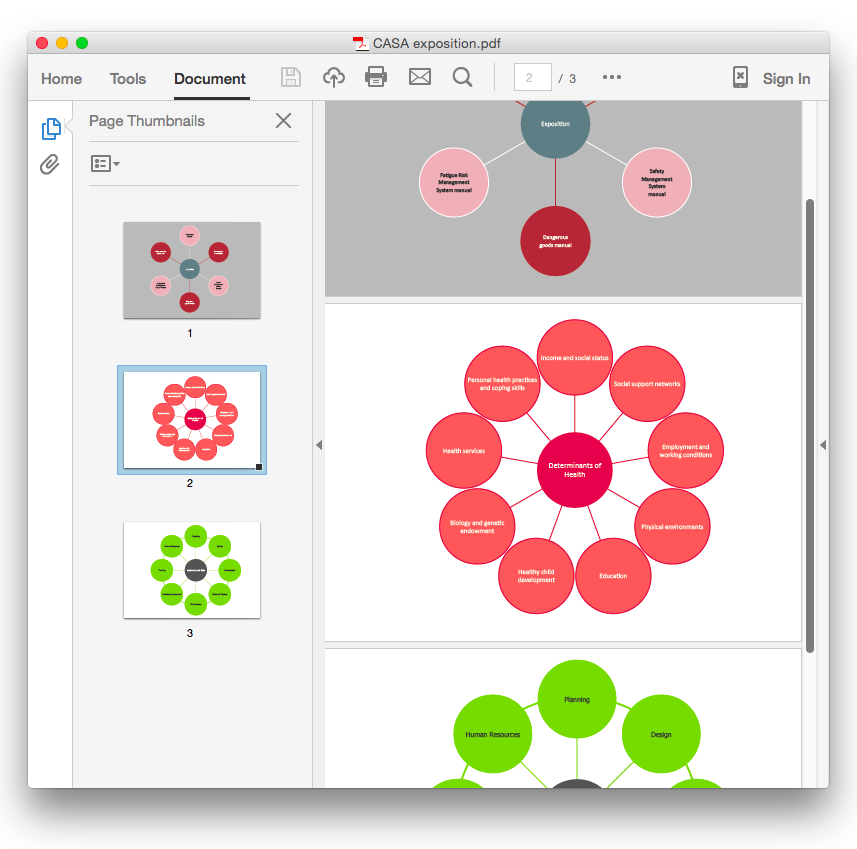
How To Convert a Circle-Spoke Diagram to an Adobe PDF Using ConceptDraw PRO
ConceptDraw PRO allows you to easy share your marketing documentation between different computers with different operating systems and applications using it's export capabilities. You can get your marketing diagrams in pdf format and avoid any problems while communicating them.HelpDesk
How to Add a Circle-Spoke Diagram to a MS Word Document Using ConceptDraw PRO
ConceptDraw PRO allows you to easily create various marketing charts, including the circle-spoke diagrams and then insert them into a MS Word document.HelpDesk
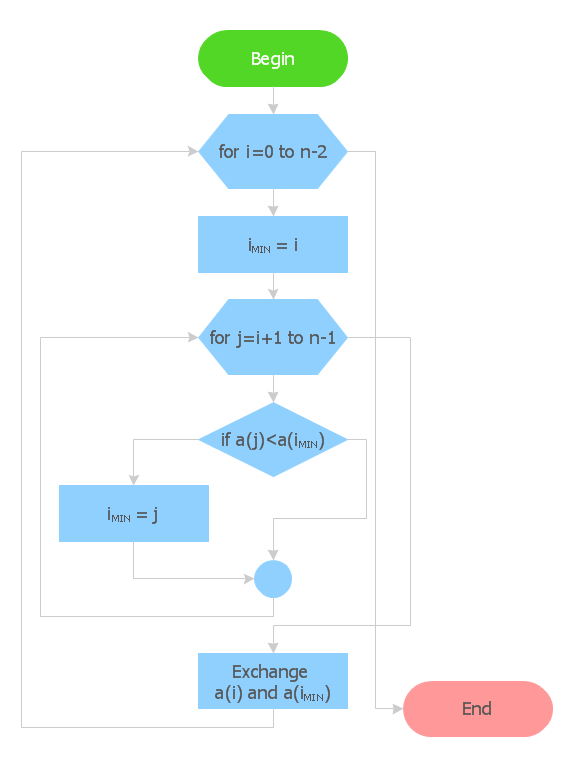
How to Create Flowchart Using Standard Flowchart Symbols
Flowcharts are used to display an algorithm for consistent execution of certain steps. Flowchart is probably the easiest way to make a graphical representation of any process. Flowcharts use the set of standard geometric symbols and arrows to define relationships. ConceptDraw PRO allows you to create professional flowchart quickly and easily. The ability to create flowcharts is contained in the Flowcharts solution. The solution provides a set of special tools for creating flowcharts.HelpDesk
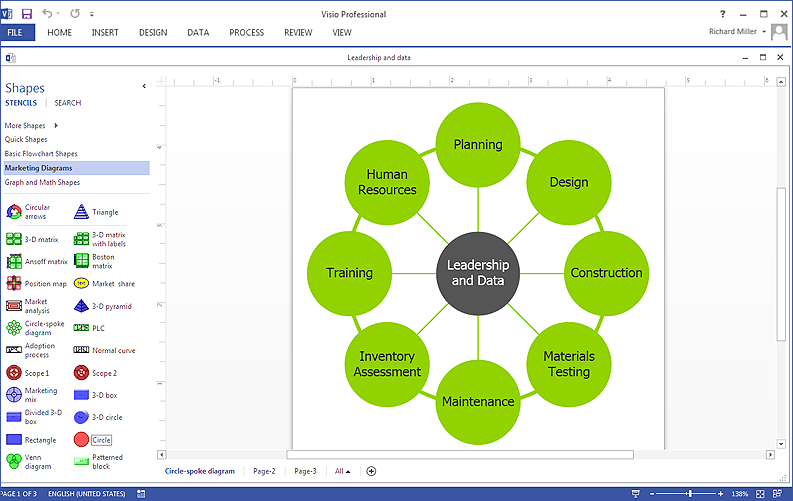
How To Create a Visio Circle-Spoke Diagram Using ConceptDraw PRO
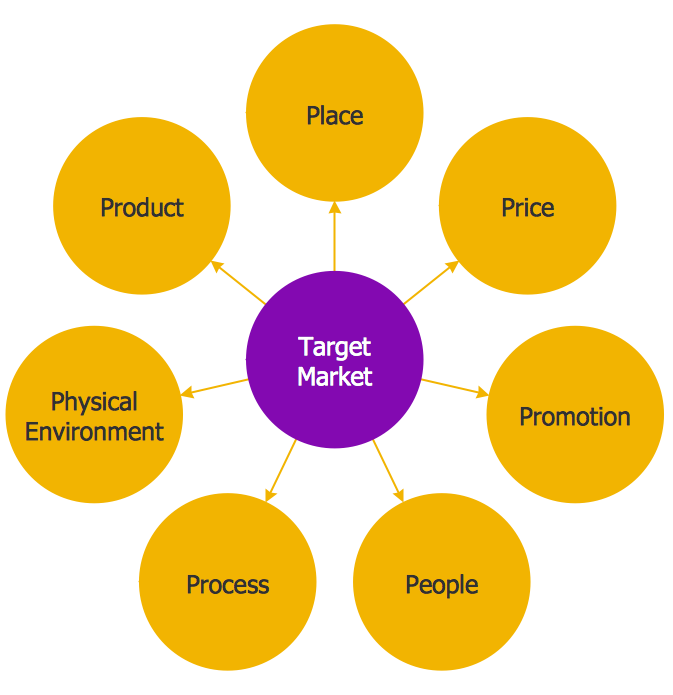
Circle Spoke Diagram consists from a central round balloon , wich is circled with other balloons as a ring . The Circle Spoke Diagram is usually used in marketing . It shows the relationships of entities and the central element. Circle Spoke Diagram can be used in marketing documentation and presentations. ConceptDraw PRO allows you to easily create marketing charts of any complexity, including the circle-spoke diagram and then make a MS Visio file from your diagram in a few simple steps. You can easily design your business documentation and share it easily with MS Visio users."In elementary algebra, a quadratic equation (from the Latin quadratus for "square") is any equation having the form
ax^2+bx+c=0
where x represents an unknown, and a, b, and c are constants with a not equal to 0. If a = 0, then the equation is linear, not quadratic. The constants a, b, and c are called, respectively, the quadratic coefficient, the linear coefficient and the constant or free term.
Because the quadratic equation involves only one unknown, it is called "univariate". The quadratic equation only contains powers of x that are non-negative integers, and therefore it is a polynomial equation, and in particular it is a second degree polynomial equation since the greatest power is two.
Quadratic equations can be solved by a process known in American English as factoring and in other varieties of English as factorising, by completing the square, by using the quadratic formula, or by graphing." [Quadratic equation. Wikipedia]
The flowchart example "Solving quadratic equation algorithm" was created using the ConceptDraw PRO diagramming and vector drawing software extended with the Mathematics solution from the Science and Education area of ConceptDraw Solution Park.
HelpDesk
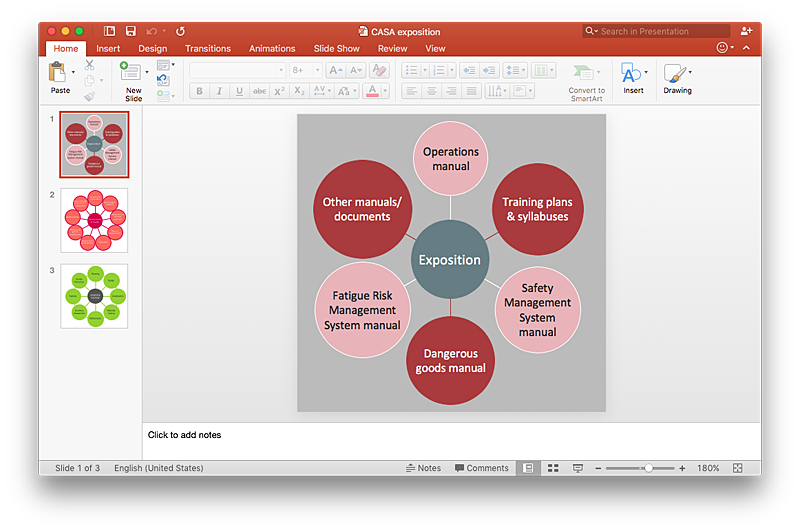
How to Add a Circle-spoke Diagram to a PowerPoint Presentation Using ConceptDraw PRO
ConceptDraw PRO can be used as a tool for creating circle spoke diagrams along with other marketing diagrams. ConceptDraw PRO allows you to make a MS PowerPoint Presentation from your marketing diagrams in a few simple steps.HelpDesk
How to Draw a Circle-Spoke Diagram Using ConceptDraw PRO
Making circle-spoke diagram is a very useful technique if you want to explore cause and effect. A Circle-Spoke Diagram is a tool that is often used in marketing sphere. Circle-spoke diagram consists from a central circle surrounded in a round arrangement by related sub-circles. They are used to depict the features or components of a central item in a number of areas. Circle-spoke diagram are widely used in marketing and management documents as well as presentations. A Circle-Spoke Diagram is a very useful tool if you want to perform the Cause and Effect analysis. ConceptDraw PRO delivers the ability to make circle-spoke diagrams of various styles with its Circle-Spoke Diagrams solution.- Area Of Circle Of Flow Chart
- Material Requisition Flowchart . Flowchart Examples | Solving ...
- Computer Graphics All Programs Flowchart And Algorithm
- Circle Flow Chart
- Algorithm Flowchart Program In C For Geometric Figures Circle
- Basic Flowchart Symbols and Meaning | Circle Spoke Diagram ...
- What Is Flow Chart Draw Area Of Circle Flow Chart
- Basic Flowchart Symbols and Meaning | 3 Circle Venn Diagram ...
- Compute Area Of Circle C Program Flow Chart
- Flowchart And Algorithm Circular Ring
- What Is a Circle Spoke Diagram | Definition Flowchart | SYSML ...
- Circle Diagrams | Basic Flowchart Symbols and Meaning ...
- Basic Flowchart Symbols and Meaning | What Is a Circle Spoke ...
- Draw Flowchart Charts For Finding Area Of A Circle
- Basic Flowchart Symbols and Meaning | 3 Circle Venn Diagram ...
- Basic Flowchart Symbols and Meaning | Pie Chart Software ...
- Flow Chart With Using Symbols For The Area Of Circle Program
- Material Requisition Flowchart . Flowchart Examples | 3 Circle Venn ...
- Flowchart To Calculate Area Of Circle
- Basic Flowchart Symbols and Meaning | What Is a Circle Spoke ...
