Developing Entity Relationship Diagrams
When you need to visually represent the structure of relational database, Entity relationship diagram (ERD) is a type of diagram for that case. Most entity-relationship diagrams can be built with objects from Flowchart solution or ERD Solution which contains inbuilt templates. Follow these steps to create your own custom ERD diagram. Don't be frightened if it looks complex, ConceptDraw DIAGRAM makes it easy to create an ERD, and hundreds of other diagrams, in minutes.How to Draw EPC Diagram Quickly
An event-driven process chain diagram is a flowchart used in business process analysis. It evolved from Architecture of Integrated Information Systems (ARIS) and utilised in the business process improvement and analysis. It is also used to facilitate enterprise resource planning. An EPC diagram is a complex flowchart that shows different business processes through various workflows. The workflows are seen as functions and events that are connected by different teams or people, as well as tasks that allow business processes to be executed. ConceptDraw DIAGRAM is a software for making EPC diagrams that allows managers visually present business process models for making decisions for business.
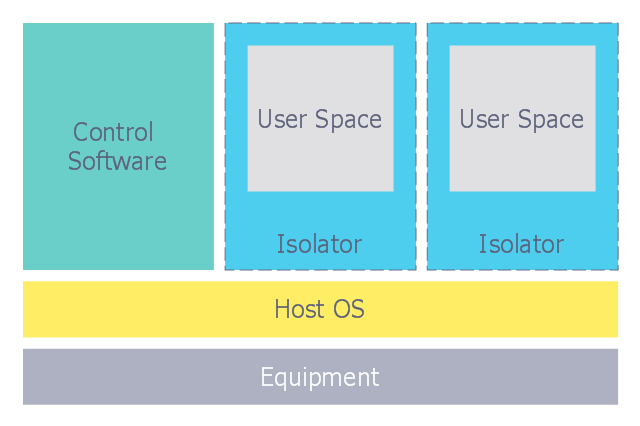
This computer security diagram example was designed on the base of the Wikimedia Commons file: Diagramme ArchiIsolateur.png.
"Virtualization, architecture of an isolator."
[commons.wikimedia.org/ wiki/ File:Diagramme_ ArchiIsolateur.png]
This file is licensed under the Creative Commons Attribution-Share Alike 3.0 Unported license. [creativecommons.org/ licenses/ by-sa/ 3.0/ deed.en]
"In computing, virtualization refers to the act of creating a virtual (rather than actual) version of something, including virtual computer hardware platforms, operating systems, storage devices, and computer network resources." [Virtualization. Wikipedia]
The cybersecurity diagram example "Isolator architecture" was created using the ConceprDraw PRO software extended with the Network Security Diagrams solution from the Computer and Neworks area of ConceptDraw Solution Park.
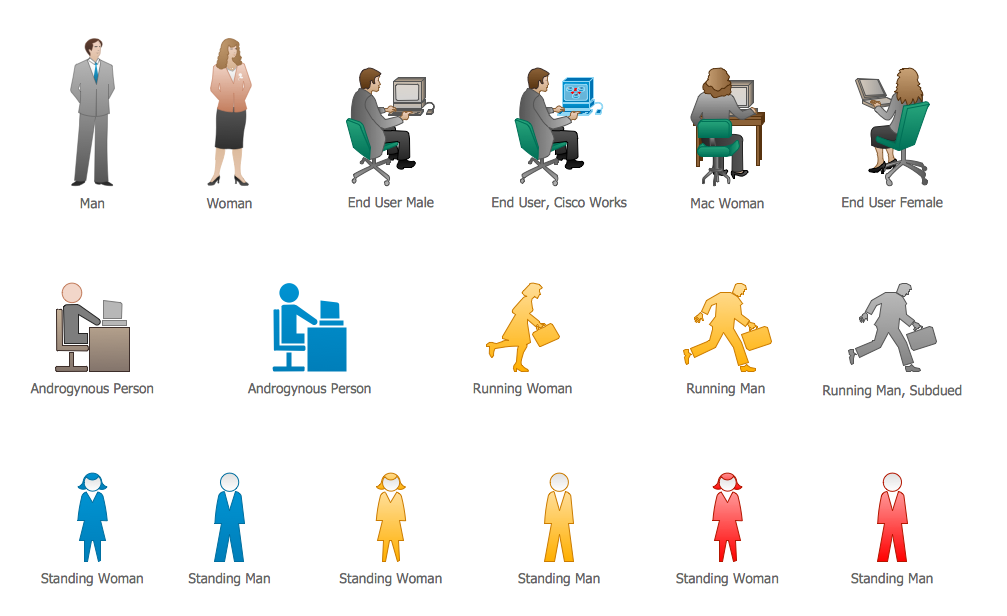
Cisco People. Cisco icons, shapes, stencils and symbols
The ConceptDraw vector stencils library Cisco People contains symbols for drawing the computer network diagrams. Vector stencils library "Cisco People" contains 17 pictogram symbols and clipart for drawing the computer network diagrams using the ConceptDraw DIAGRAM diagramming and vector drawing software.Network Topology Mapper
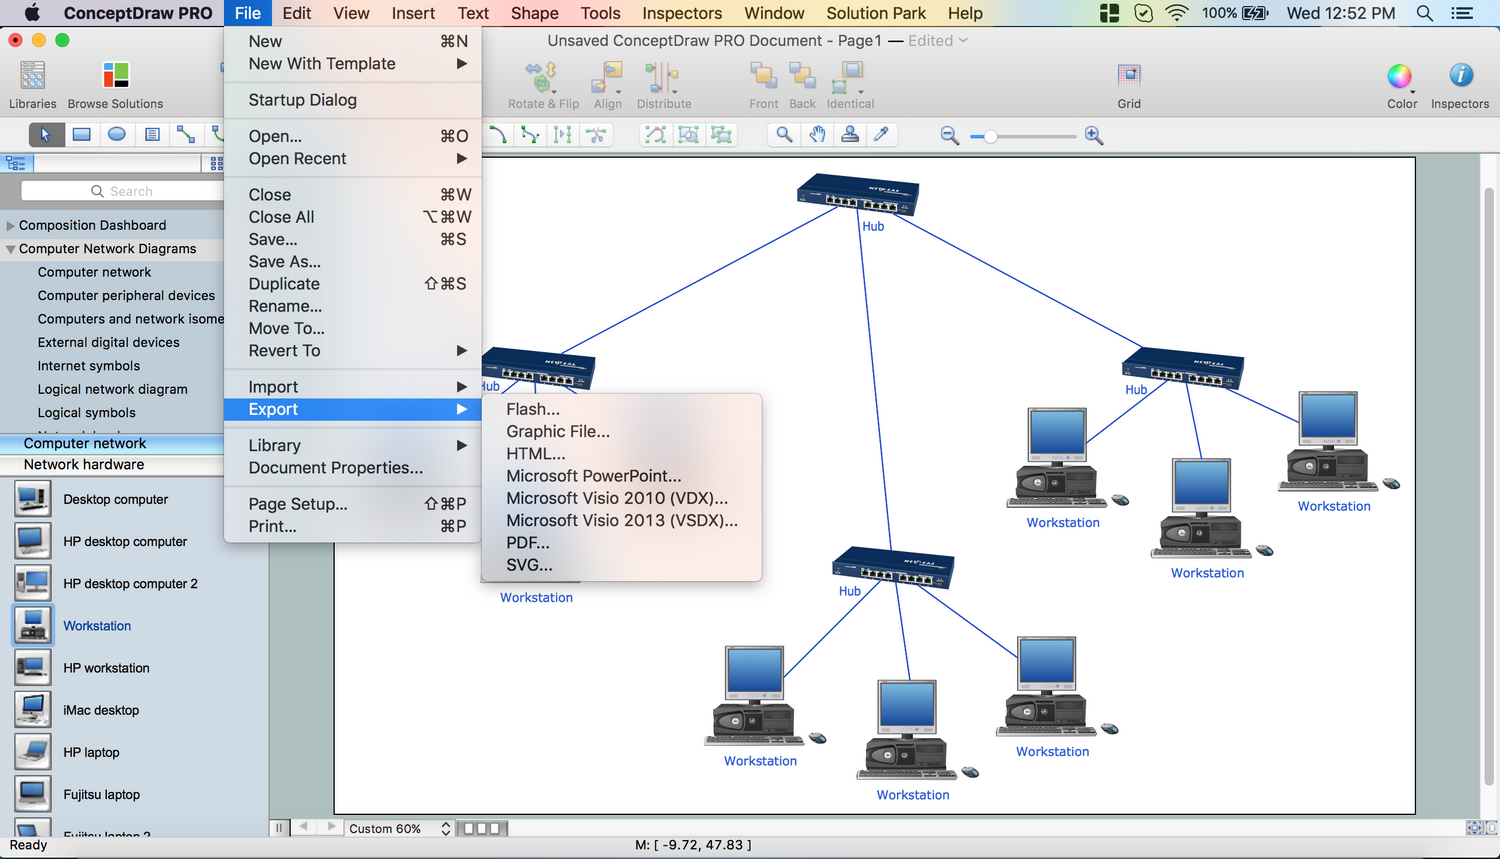
Network Topology in communication networks, a topology is a usually schematic description of the arrangement of a network, including its nodes and connecting lines. There are two ways of defining network geometry: the physical topology and the logical topology. Network Topology Mapper offers extensive drawing tools professional-looking network diagrams quickly and easily allowing you to clearly represent and communicate network architecture, topology, and design to engineers, stakeholders and end-users.The vector stencils library "Cloud shapes" contains 69 geometric shapes.
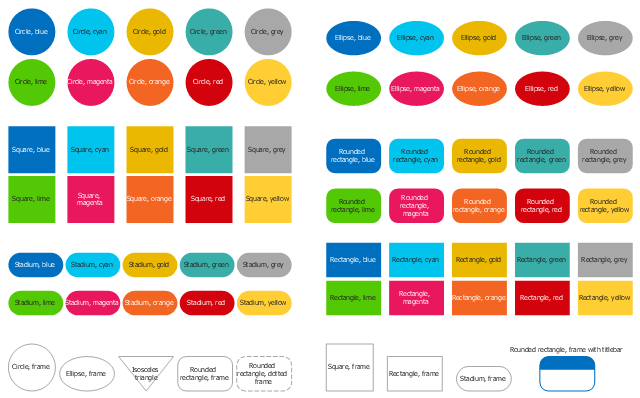
Use it to design your cloud computing diagrams and infographics with ConceptDraw PRO software.
"The essence of a diagram can be seen as: ...
- with building blocks such as geometrical shapes connected by lines, arrows, or other visual links." [Diagram. Wikipedia]
The geometric shapes example "Design elements - Cloud shapes" is included in the Cloud Computing Diagrams solution from the Computer and Networks area from ConceptDraw Solution Park.
How to Build Cloud Computing Diagram Principal Cloud Manufacturing
The term “cloud” is very popular and widely used now, it is a server, data processing centre, or a network which lets to store the data and software, provides access to them, allows to run applications without installation and gives the possibility to process data hosted remotely via the Internet connection. For documenting the Cloud Computing Architecture with a goal to facilitate the communication between stakeholders are successfully used the Cloud Computing Architecture diagrams. It is convenient and easy to draw various Cloud Computing Architecture diagrams in ConceptDraw DIAGRAM software with help of tools of the Cloud Computing Diagrams Solution from the Computer and Networks Area of ConceptDraw Solution Park.How To Create CCTV Network Diagram
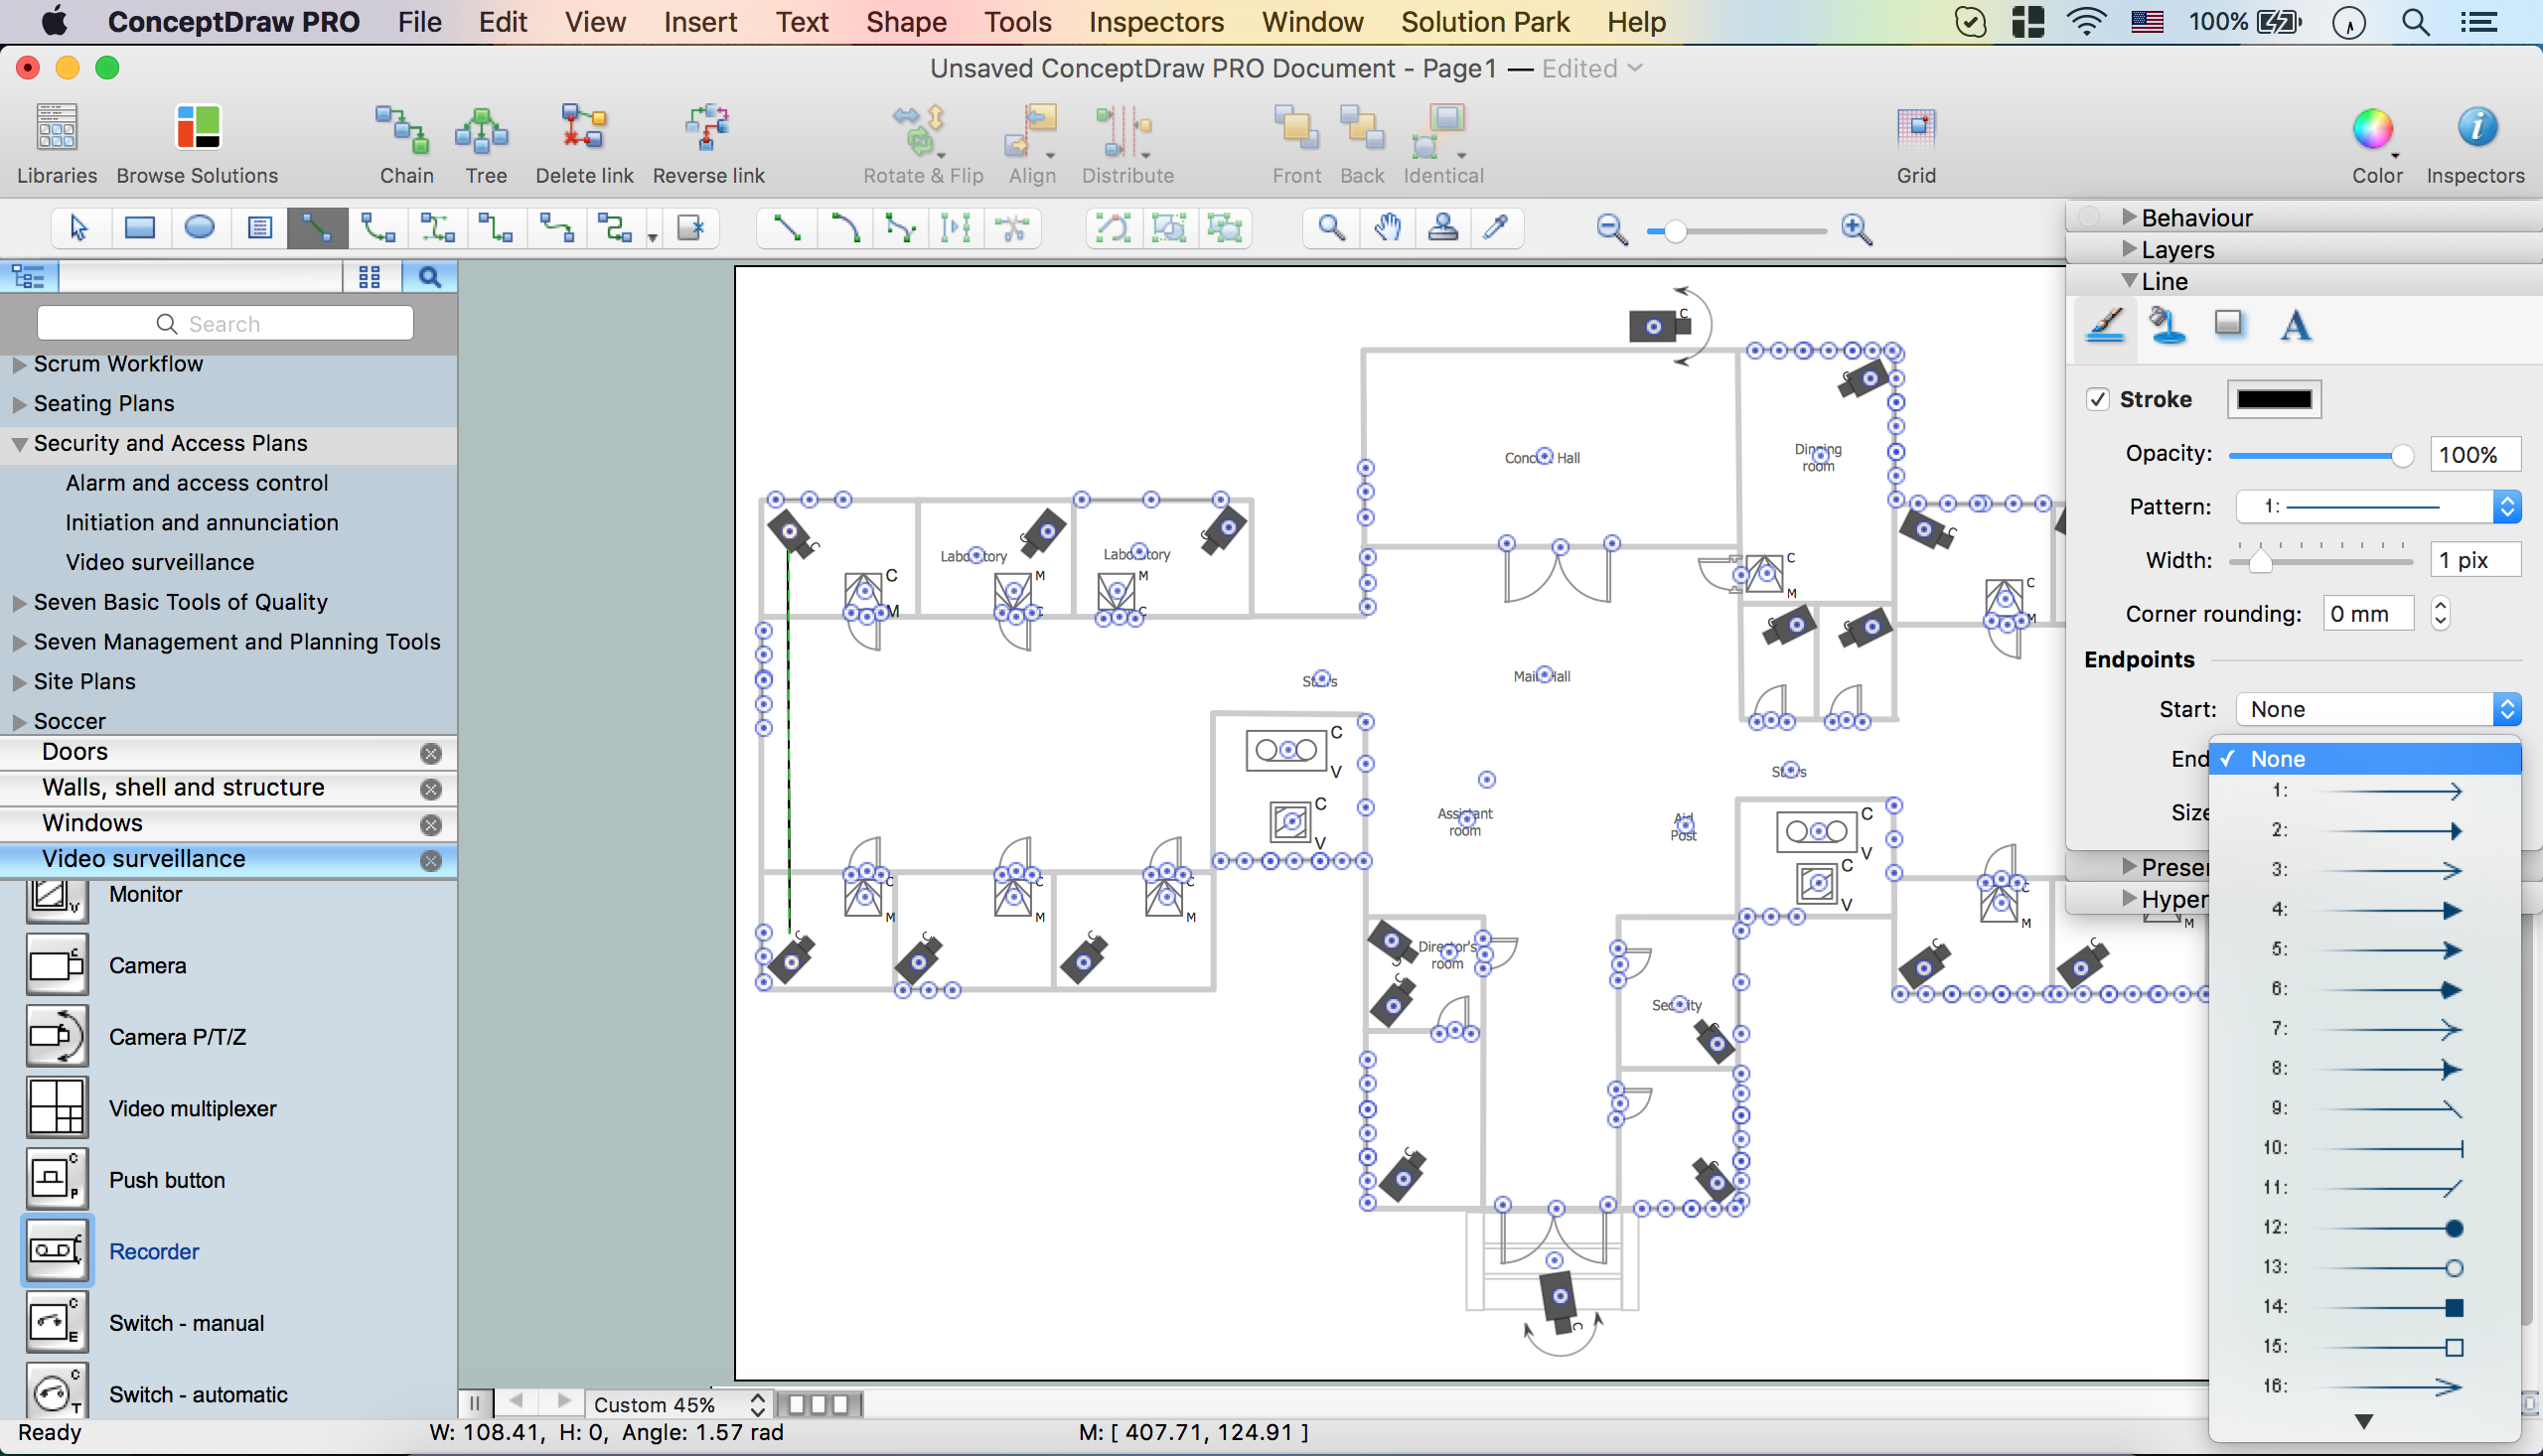
Closed-circuit television (CCTV) uses cameras and monitors to carry out video surveillance. Unlike broadcast television this system has only local signal. It is a feature of almost every video camera, yet CCTV is mainly a system for visual control of certain areas such as banks, airports, supermarkets, and other places for security reasons. Developing and installing CCTV system is a time-consuming process. It also requires certain knowledge and skills. ConceptDraw is a solution of setting video cameras rationally. You can achieve two aims at once: CCTV Design Tool saves your time and your money and helps you make professional video surveillance system.How to Build a Flowchart
The ConceptDraw DIAGRAM is a professional software for quick creating great looking flowcharts. The vector stencils from object libraries allows you to use RapidDraw technology. By the clicking on direction arrows one can add new object to flowcharts. This technology gives to users the ability to fast creating visualization for the structural data. Learn the basics of flowcharting and see how to build create a flowchart using ConceptDraw automatic drawing tools.The vector stencils library "Cisco people" contains 17 pictogram symbols and clipart icons of people for drawing Cisco computer network diagrams.
The symbols example "Cisco people - Vector stencils library" was created using the ConceptDraw PRO diagramming and vector drawing software extended with the Cisco Network Diagrams solution from the Computer and Networks area of ConceptDraw Solution Park.
www.conceptdraw.com/ solution-park/ computer-networks-cisco
Electrical Diagram Software
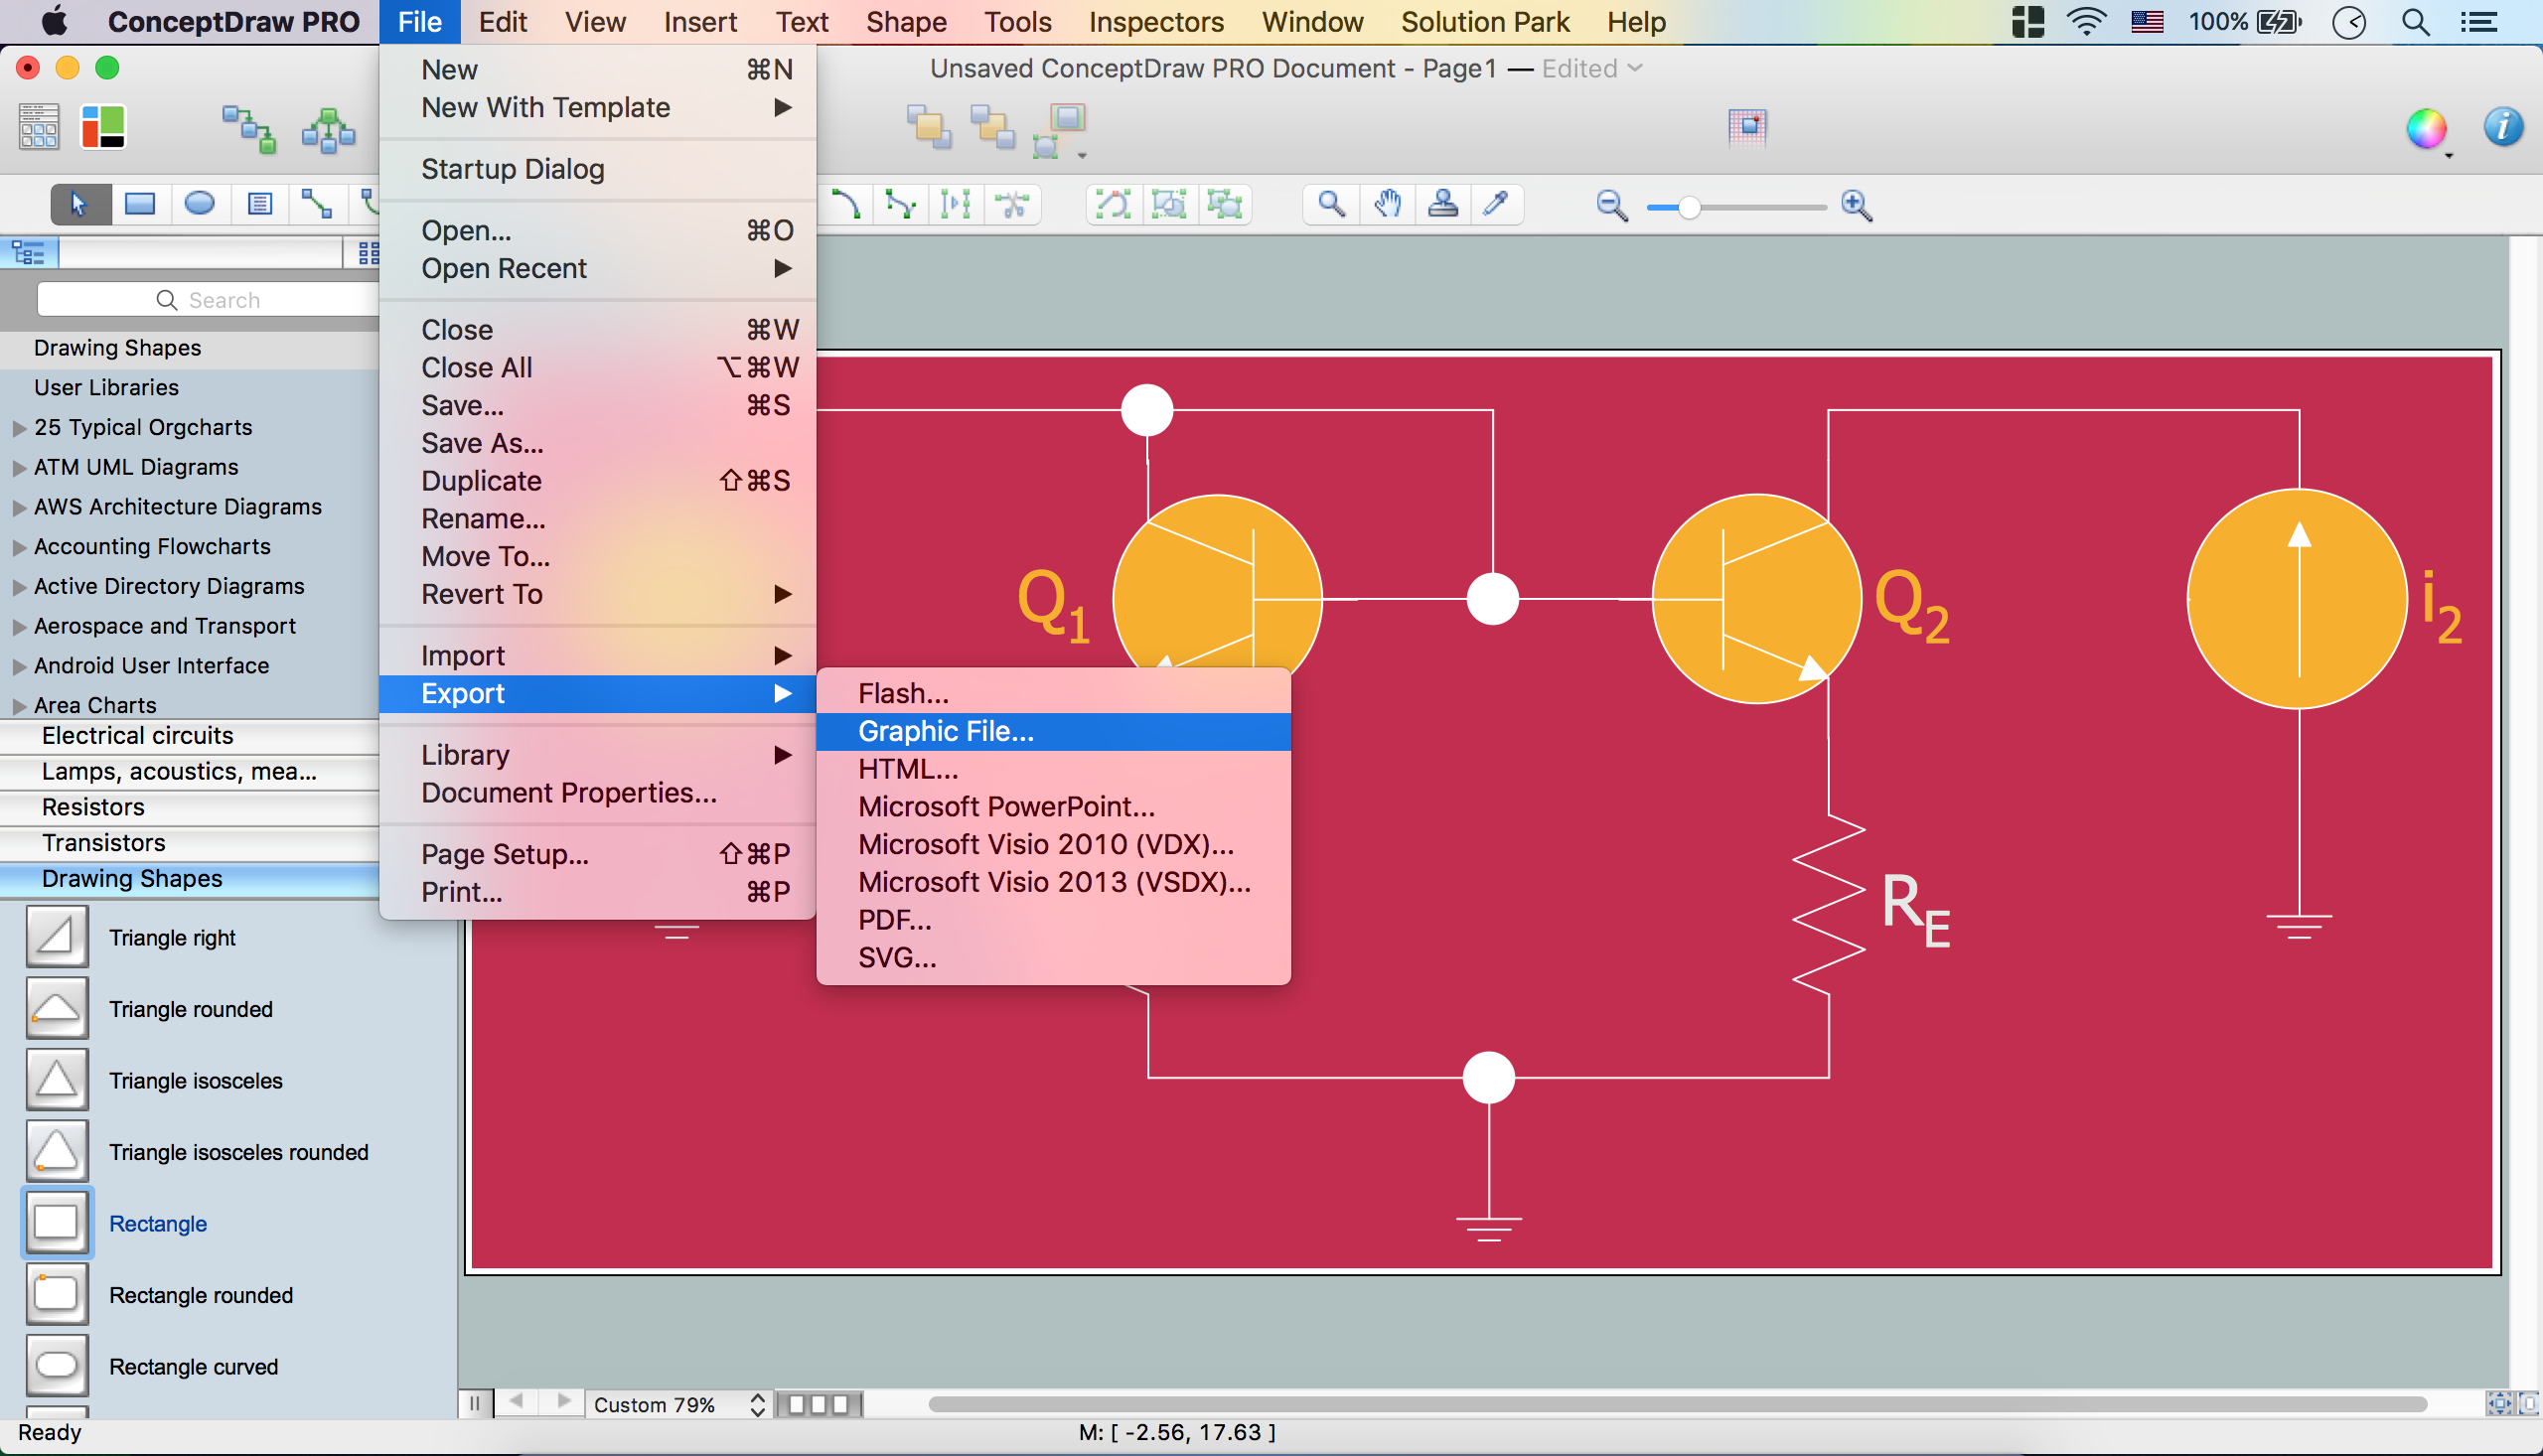
Electrical engineering and electronic engineering are extensive fields dedicated to research, design, development, manufacturing, test, and montage of systems and devices of electricity, electronics, microelectronics, telecommunications, power engineering, etc. These fields use various types of schemes, diagrams, technical drawings and require a special precision, accuracy and attention at their construction and using. The availability of modern specialized software has great importance for electrical engineers and electronic specialists, it assists them in drawing Electrical schematics and diagrams, Electrical drawings and Wiring schemes, Electronic Circuit schematics, etc. One of such software is ConceptDraw DIAGRAM extended with Electrical Engineering Solution that offers powerful drawing tools, wide variety of samples and libraries with numerous quantity of predesigned electrical symbols and vector objects of electrical devices. All they help design with minimal efforts Electrical diagrams and blueprints of any complexity, now drawing process is easy even for beginners.
Business Process Workflow Diagram
Business Process Workflow Diagram is a professional visual tool that is widely applied for business development, business analysis, business process optimization and documenting business processes. Business Process Workflow Diagram lets depict in details the steps of business processes and flow of tasks between them, the execution of business processes, transfer of data and documents. The workflows on the Business Process Workflow Diagram are represented using the set of common symbols which let easy illustrate business processes and process flows, depict the start, all major steps and end of the process, what data are used by the process, how the data flow through the business areas within scope of our project, how the tasks are executed and by who, and how workers interact with each other.
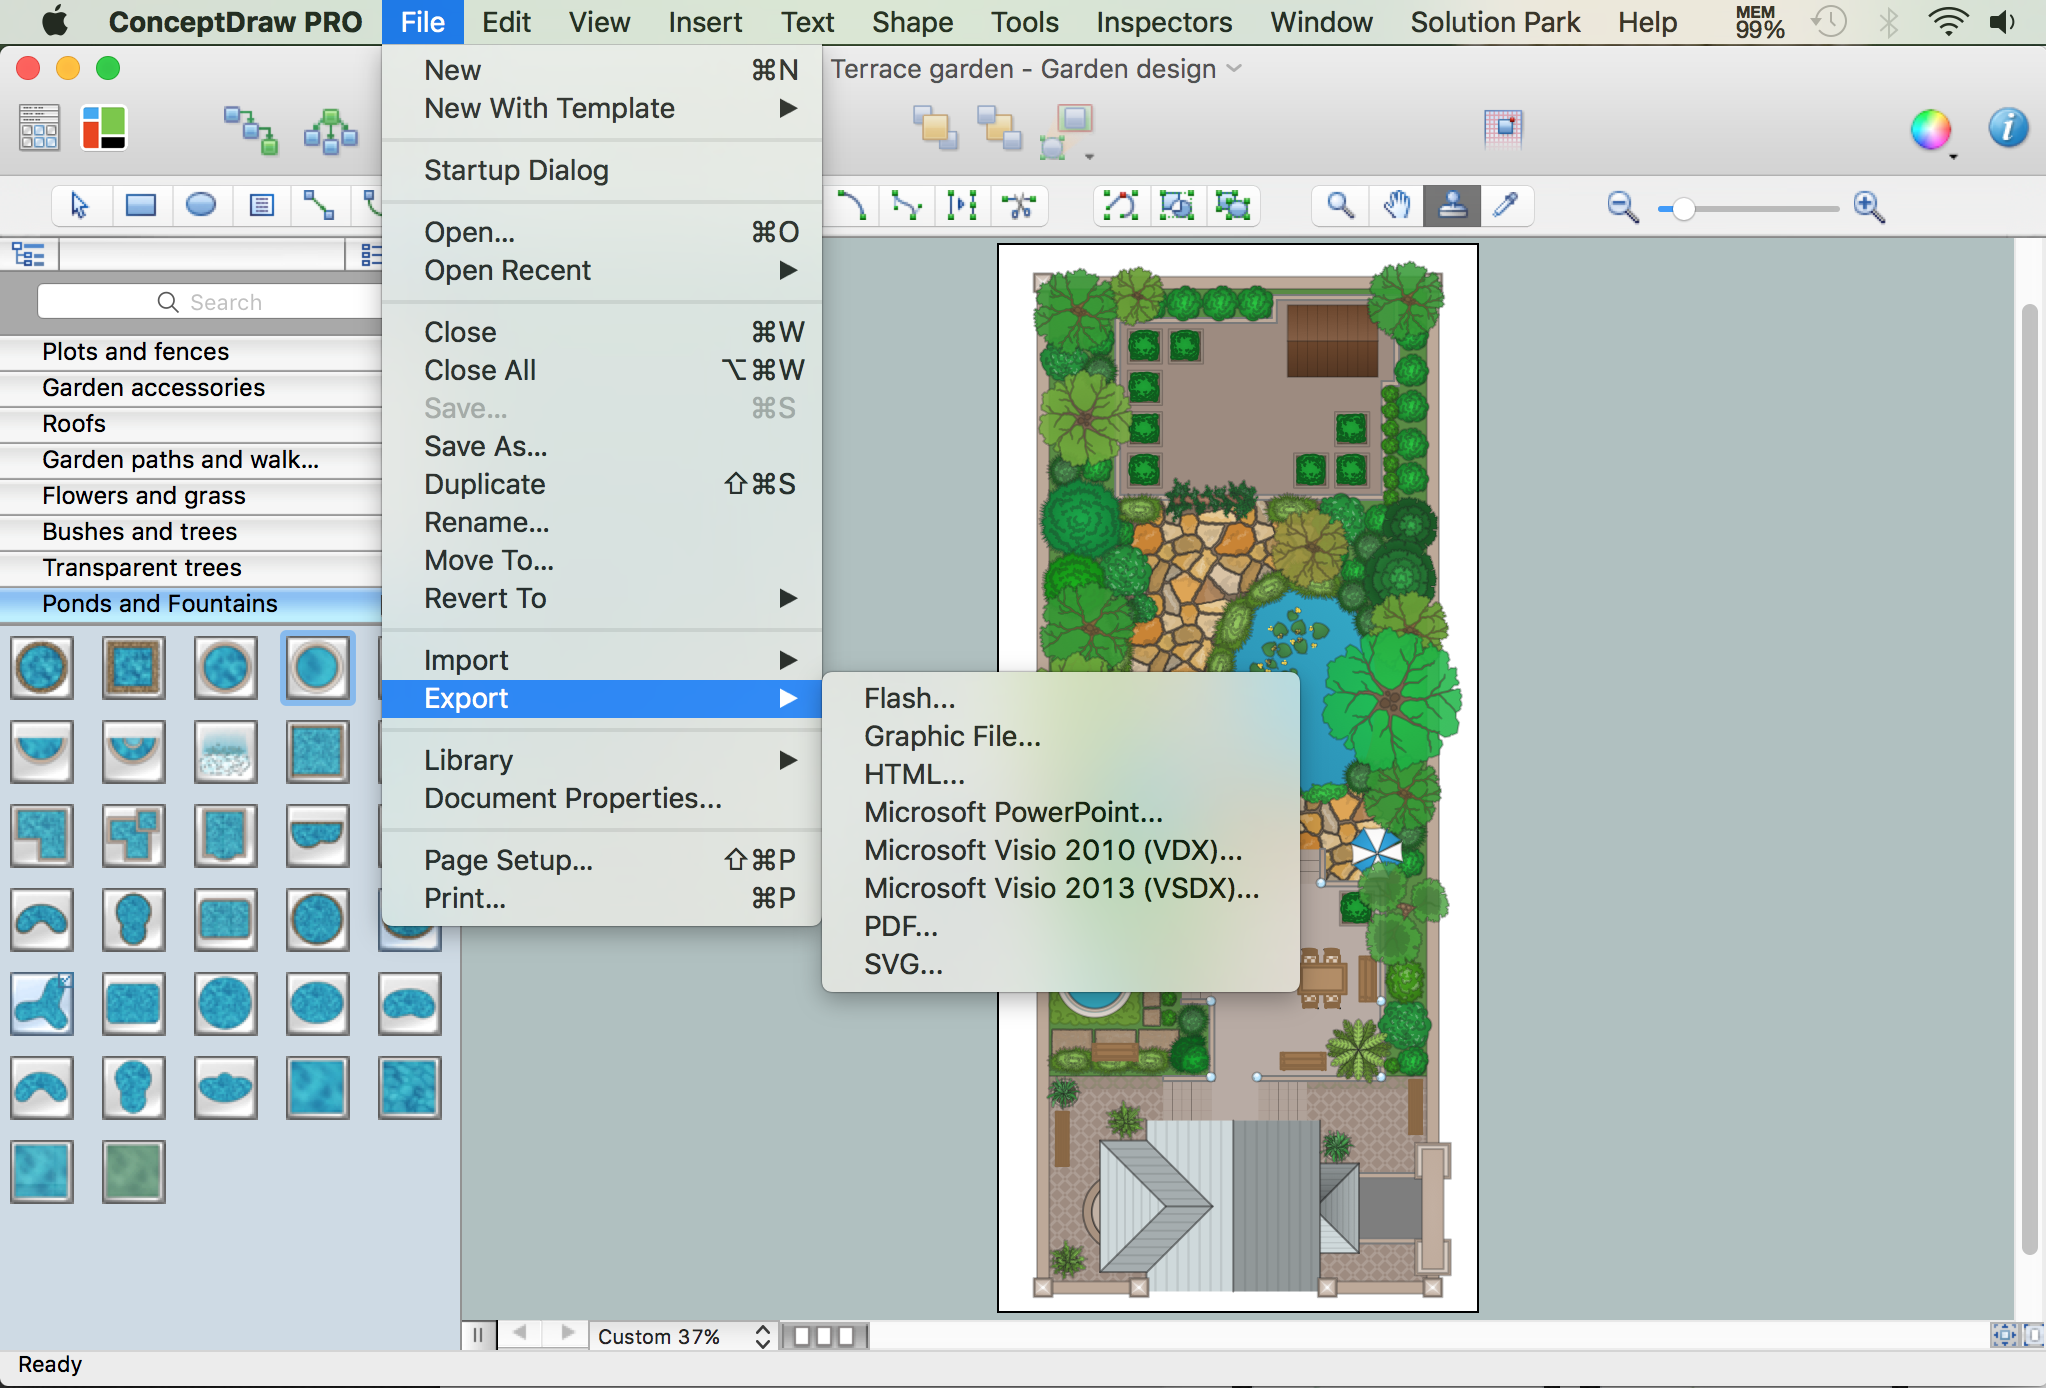
How to Draw a Landscape Design Plan
What is landscape design? It's a floor plan but for an outdoor area. Same as a floor plan, a landscape design represents visually any site using scaled dimensions. The main purpose of landscape design is to plan the layout for an outdoor area no matter is it a personal site plan for your home or a commercial plan for business. It may also be handful when a new installation, repair or even an outdoor event is planning. It helps to calculate time and decide which materials should be used in your project. Landscape designs perfectly gives the property owner and landscape contractor better vision for cost estimation, helping to ensure the project time and budget.Diagrams Mean Nothing
You are probably familiar with diagrams. But have you ever thought that they are useless? This article will explain you why.Scrum process work items and workflow
Teams working with Scrum methodology use the product backlog items (PBIs), bug work item types (WITs), reports and dashboards. SCRUM Workflow solution for ConceptDraw DIAGRAM software offers collection of samples, variety of predesigned objects, clipart and graphic elements, a set of Scrum process work items and workflow which are developed for agile teams working using Scrum.- Active Directory Diagram | Cloud round icons - Vector stencils library ...
- Circular diagrams - Vector stencils library | Status indicators - Vector ...
- iPhone User Interface | UML in 10 mins | SWOT Analysis | Yellow ...
- Visio Yellow People Icon
- Process Flowchart | Computer Network Diagrams | Taxi Service ...
- Circle-spoke diagram - Vector stencils library | Circular diagrams ...
- UML Sequence Diagram . Design Elements | How To Do A Mind ...
- Yellow Arrows Down Png
- Png Yellow Arrow
- Yellow Football Card
- Diagram Of A Man Running
- Currency - Vector stencils library | Pyramid Diagram | Basic ...
- Arrow Png Yellow
- Football (Soccer) - Vector stencils library | Football (Soccer) - Vector ...
- Yellow Stream Png
- Running Man Diagram
- Diagram Of The Planets And Their Moons Including Pluto
- Sun Planet Diagram
- People Sitting Diagram
- UML Use Case Diagram Example Registration System | Winter ...


