 Data Flow Diagrams (DFD)
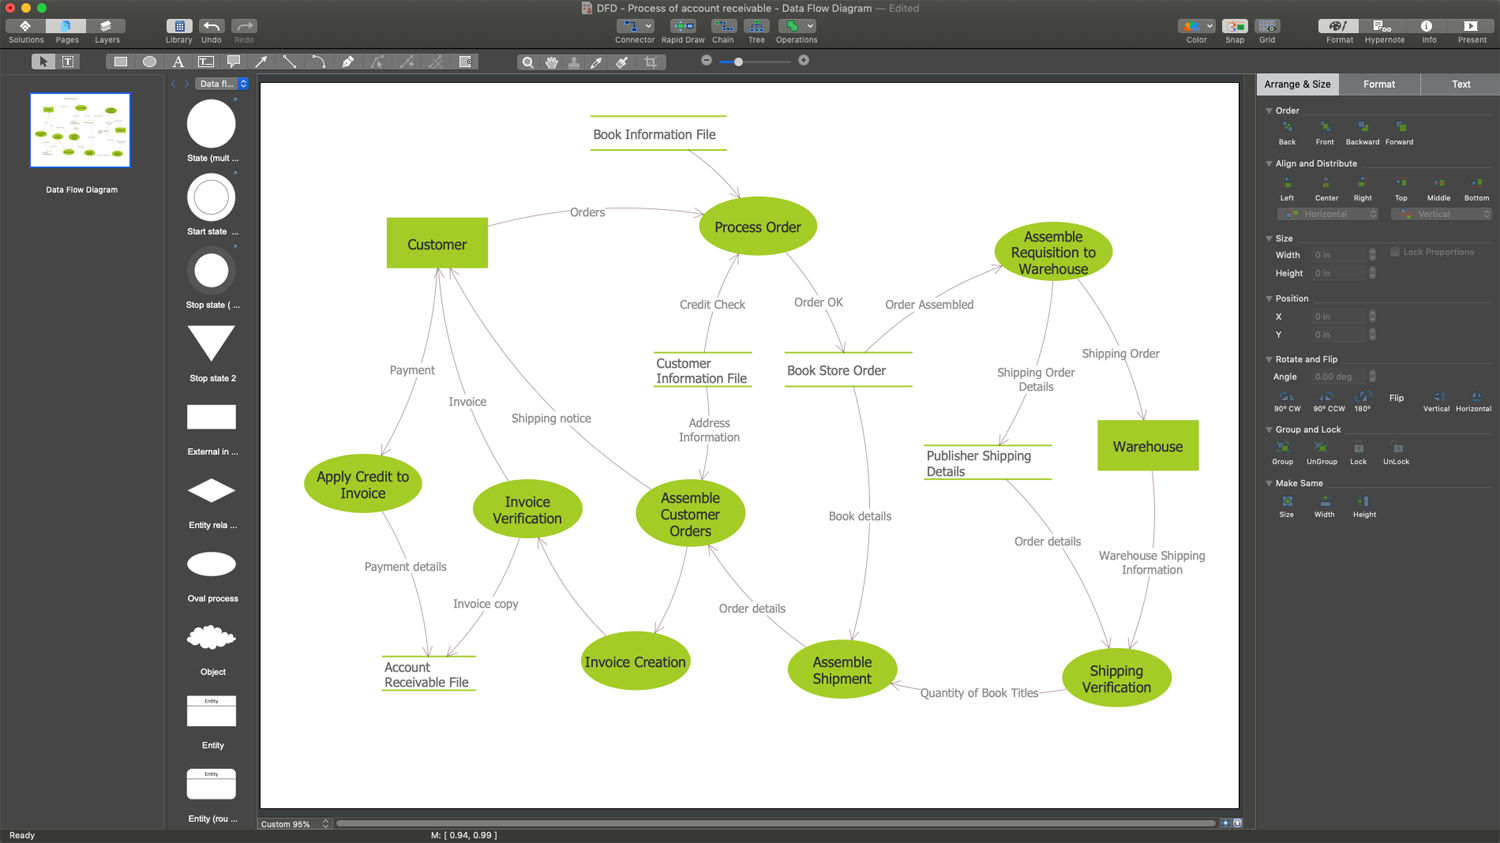
The use of Data Flow Diagrams (DFD) solution as an extension to the ConceptDraw DIAGRAM tool can simplify its users’ work by creating any necessary Data Flow Diagram, which can help simulate multiple data flows and illustrate the functional requirements of the system or business process. Using the pre-made templates and samples of the DFDs, and as the stencil libraries full of DFD-related design elements, any ConceptDraw DIAGRAM user might find the Data Flow Diagrams (DFD) solution a useful tool for making the needed DFD drawings.
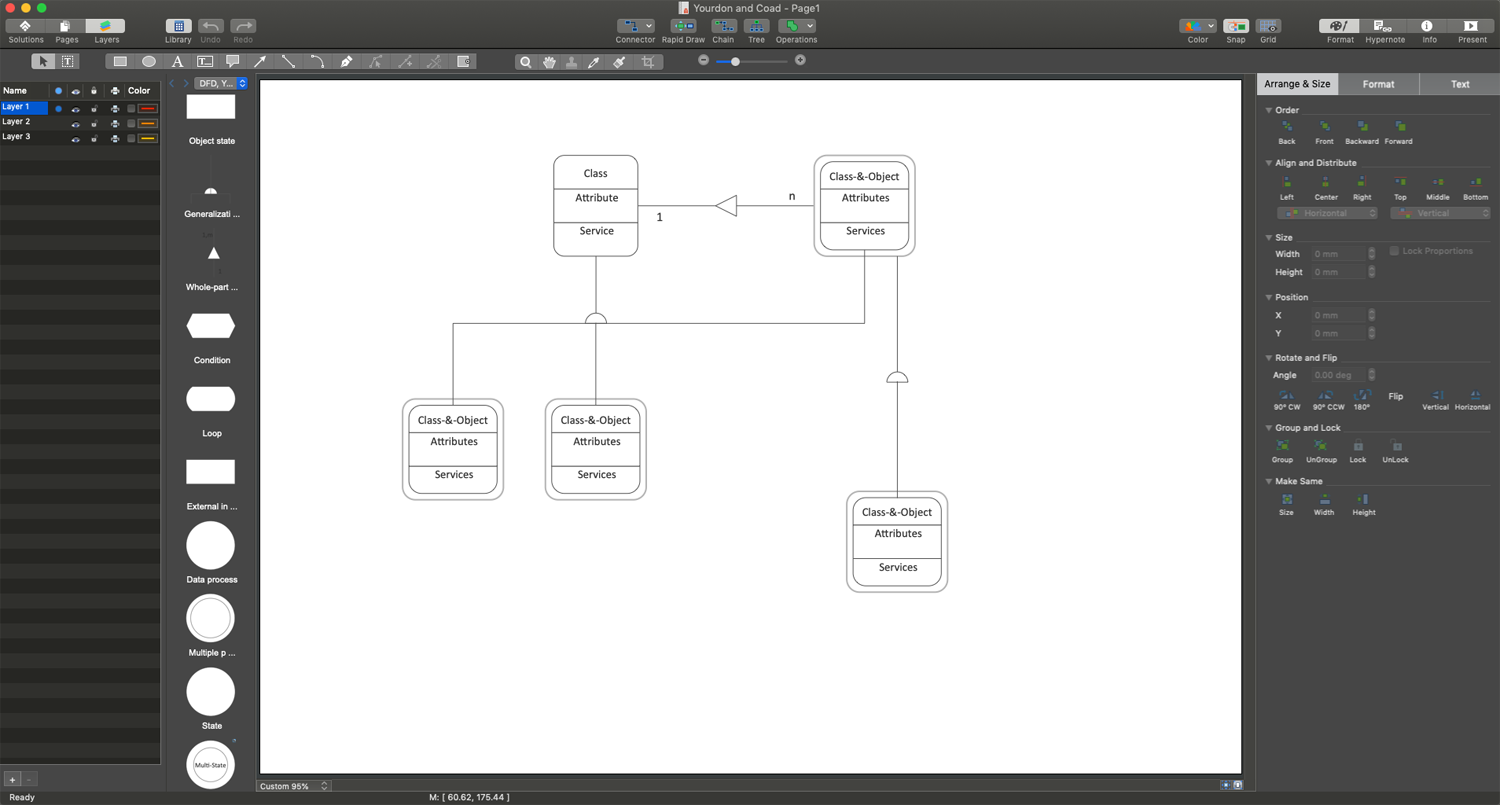
Yourdon and Coad Diagram
The vector stencils library Yourdon and Coad Notation from the solution OOAD contains specific symbols of the Yourdon and Coad notation such as data store symbol, data process symbol, loop symbol for ConceptDraw DIAGRAM diagramming and vector drawing software. The OOAD solution is contained in the Software Development area of ConceptDraw Solution Park.Data Flow Diagram Software
When studying a business process or system involving the transfer of data, it is common to use a Data Flow Diagram (DFD) to visualize how data are processed. Being initially used exclusively in regards to the flow of data through a computer system, now DFDs are employed as the business modeling tools. They are applied to describe the business events and interactions, or physical systems involving data storage and transfer. ConceptDraw DIAGRAM is a powerful Data Flow Diagram software thanks to the Data Flow Diagrams solution from the Software Development area of ConceptDraw Solution Park.Data Flow Diagram Creator
Data Flow Diagram (DFD) is an apt communication tool between the system analysts and stakeholders, because of its ability to visually describe the scope and boundaries of a system as a whole. ConceptDraw DIAGRAM enhanced with the Data Flow Diagrams solution is a useful Data Flow Diagram creator for both professional and individual goals. It helps in easily creating the Data Flow Diagrams allowing you to visualize and analyze your business processes, and then use the resulting DFDs to improve your business.Data Flow Diagram Draw in ConceptDraw DIAGRAM
ConceptDraw DIAGRAM software enhanced with the Data Flow Diagrams solution makes the Data Flow Diagrams design easier than ever. Being extended with tools and elements from both notations Gane-Sarson and Yourdon-Code, ConceptDraw DIAGRAM software makes the Data Flow Diagram draw process quick and easy.DFD Flowchart Symbols
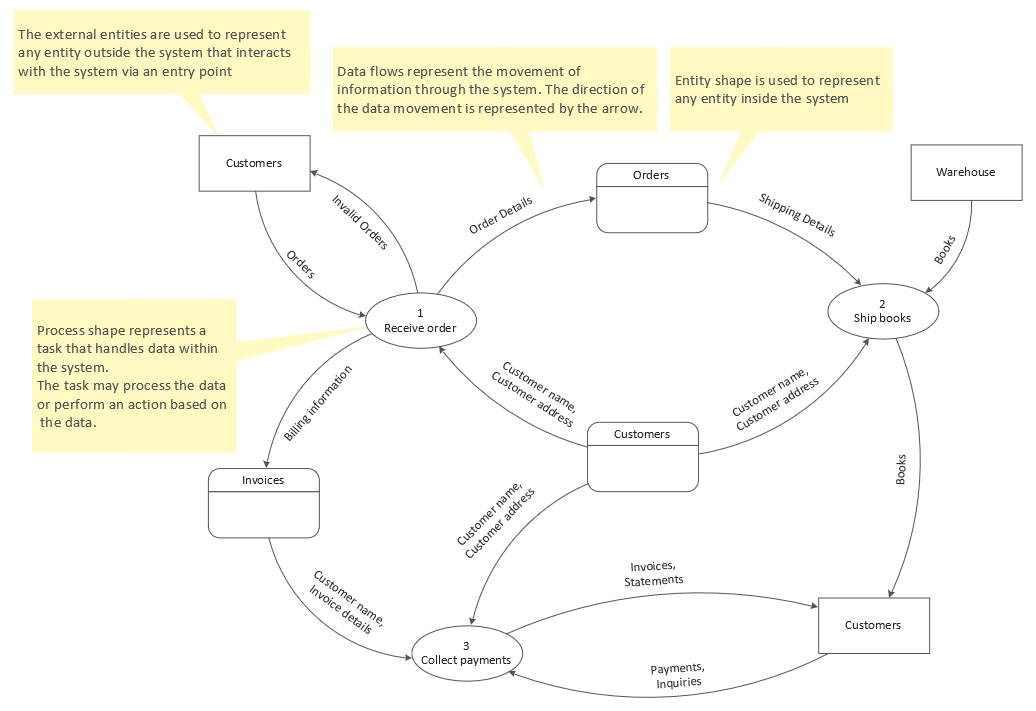
A Data Flow Diagram (DFD) is a graphical technique which allows effectively model and analyze the information processes and systems. The ability to fast and easy create the DFDs is made possible with Data Flow Diagrams solution from the Software Development area of ConceptDraw Solution Park. For designing the Data Flow Diagrams are used simple DFD flowchart symbols which are connected each other by arrows depicting the data flow from one step to another.Examples of Flowchart
This sample shows the Flowchart of the ACC general account creation. This Flowchart describes the Start point, the process of the handling the user requests and the End point – creating of the account. The shapes represent the subprocesses and the arrows between the shapes shows the sequence of the actions. This sample was created in ConceptDraw DIAGRAM diagramming and vector drawing software using the Flowcharts solution from the "Diagrams" area of ConceptDraw Solution Park.
Data Flow Chart Template
Designing a Data Flow Diagram is incredibly simple in the ConceptDraw DIAGRAM. You can start with a blank sheet or choose one of the offered DFD templates included in the Data Flow Diagrams solution. Once started with a predesigned Data Flow Chart template, use also the ready-made vector objects from the Data Flow Diagrams solution libraries.Data Flow Diagram Examples
Data flow diagrams (DFDs) are effective to reveal relationships among the various components in a program or system. This type of diagrams is an important and useful technique for modeling an information system, its process aspects, for showing a system as a single high-level process. DFD lets illustrate the flow of data, how the input data are transformed to output results across the sequence of functional transformations. DFD consists of four major components: entities, processes, data stores, data flows. When you need to draw a Data Flow Diagram the ConceptDraw DIAGRAM diagramming and vector drawing software extended with Data Flow Diagrams solution will be helpful for you. Providing numerous collection of Data Flow Diagram examples, samples, templates and ready-to-use vector DFD symbols, Data Flow Diagrams solution ensures you with all needed tools for easy designing DFDs according to Gane-Sarson or Yourdon-Coad notation on your choice. Any from offered predesigned DFD examples can become a perfect base for your own diagram.Data Flow Diagram Tool
The Data Flow Diagram tool is a visual way to represent the data processing, to model and visualize the flow of data through a computer system and functional requirements for a designed system. ConceptDraw DIAGRAM is a multifunctional software. Being extended with the Data Flow Diagrams solution, it became also a powerful Data Flow Diagram tool useful for drawing the Data Flow Diagrams of any complexity.Data Flow Diagram Templates
ConceptDraw DIAGRAM software enhanced with the Data Flow Diagrams solution is rich for the pre-made Data Flow Diagram templates: Yourdon and Code template, Data Flow Diagram template, Data Flow Model Diagram template. They are indispensable for simple Data Flow Diagrams design.Property Management Examples
This sample was created in ConceptDraw DIAGRAM diagramming and vector drawing software using the Seven Management and Planning Tools Solution from the Business Productivity area of ConceptDraw Solution Park. This sample shows the Property Management matrix, the ideas are ordered in regards to importance and frequency. This matrix gives the ability to turn the theory into quantifiable data.What can go wrong if the purchasing process is not followed?
Make sure that your purchasing process complies with the standards and regulations. Common key elements of purchasing process.Mac OS GUI Software
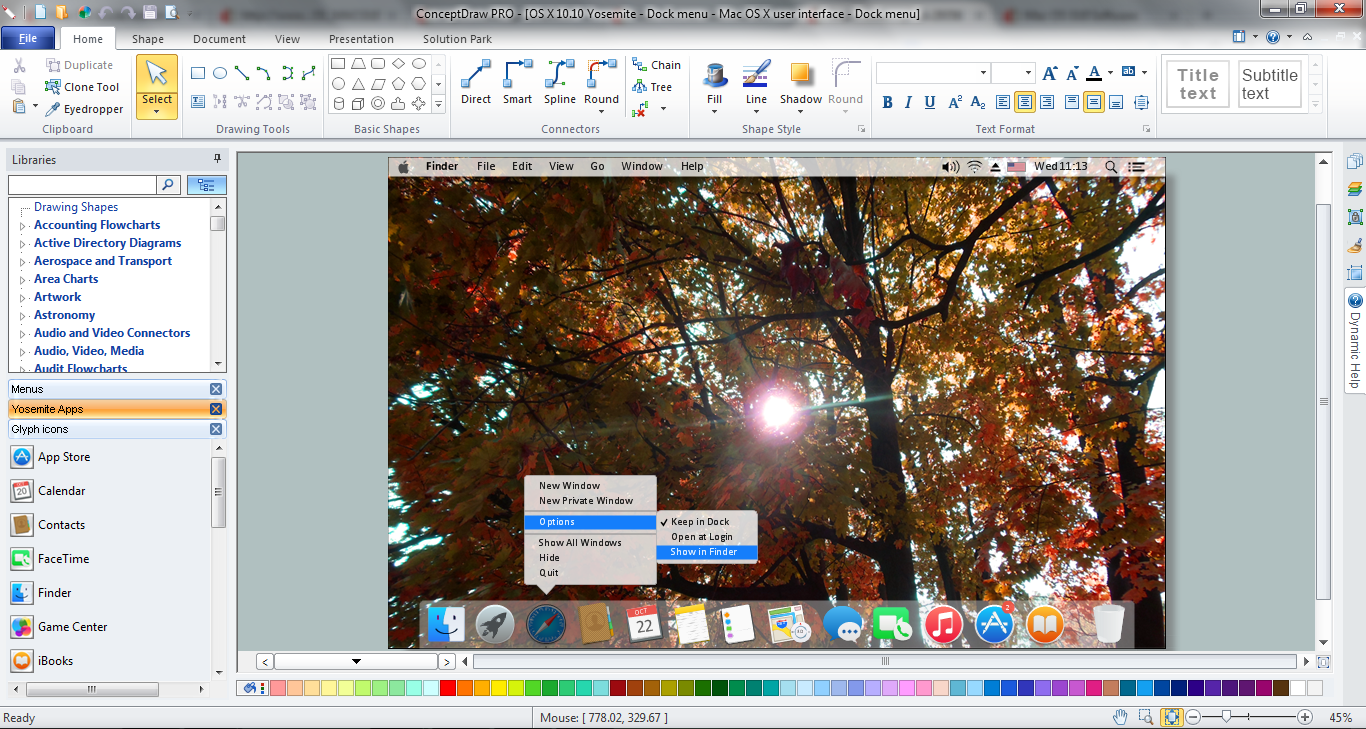
ConceptDraw DIAGRAM diagramming and vector drawing software extended with Mac OS User Interface Solution from the Software Development area is a powerful Mac OS GUI SoftwareGraphical User Interface Examples
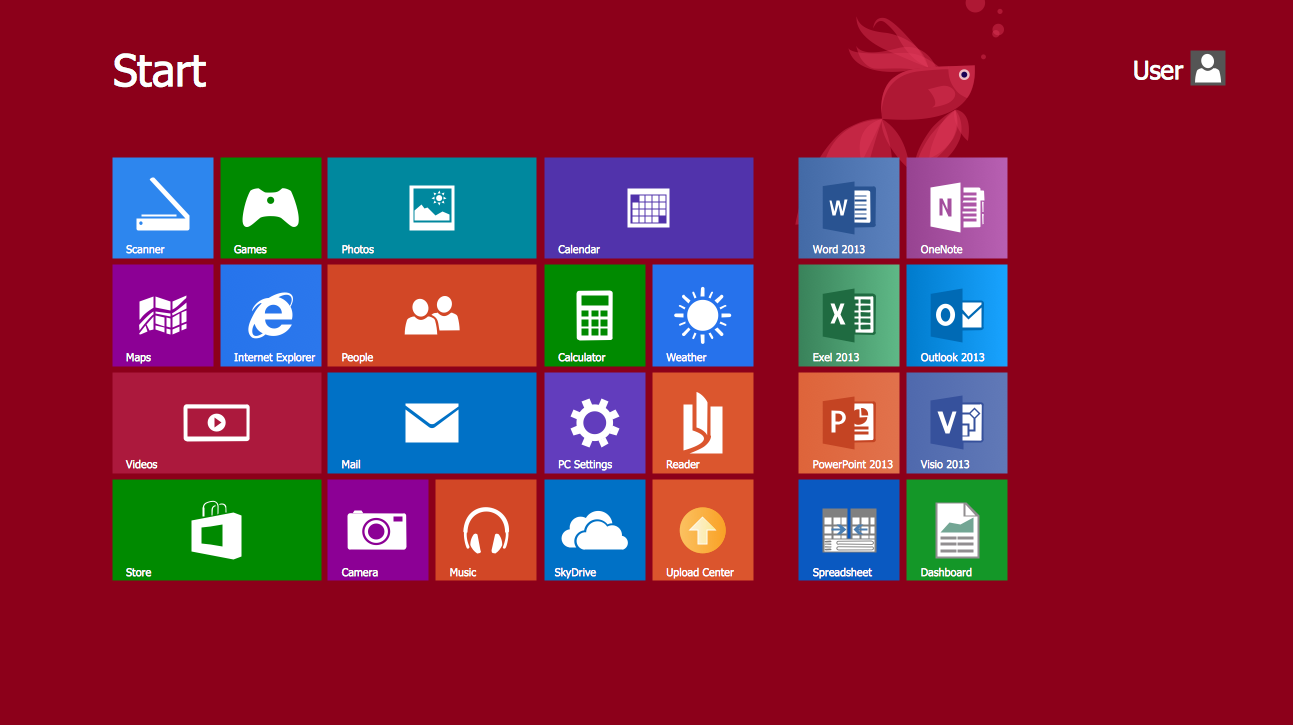
ConceptDraw DIAGRAM extended with Windows 8 User Interface solution from the Software Development area is the best gui software. Using the drawing tools, libraries of vector objects, graphical user interface examples that offers Windows 8 User Interface solution, you will easily design the Windows 8 user interfaces and Windows 8 UI design patterns of any complexity.ER Diagram Tool
Creating of Entity-Relationship Diagrams (ERDs) is a complex process that requires convenient, automated tools. ConceptDraw DIAGRAM diagramming and vector drawing software offers a powerful ER Diagram Tool - the Entity-Relationship Diagram (ERD) Solution from the Software Development Area.About UML
Use Case Diagram Taxi Service UML. This sample was created in ConceptDraw DIAGRAM diagramming and vector drawing software using the UML Use Case Diagram library of the Rapid UML Solution from the Software Development area of ConceptDraw Solution Park. This sample shows the work of the taxi service and is used by taxi stations, by airports, in the tourism field and delivery service.Information Technology Architecture
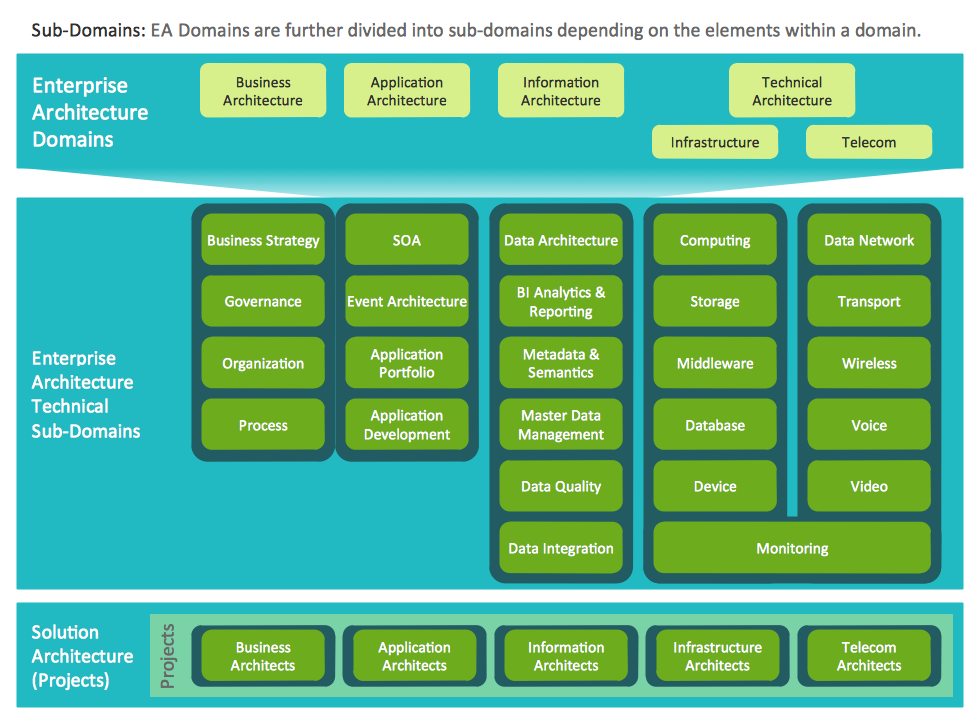
ConceptDraw DIAGRAM extended with Enterprise Architecture Diagrams Solution from the Management Area is a powerful software which provides a set of helpful tools for designing Information Technology Architecture.Astronomy Pictures
Every day astronomers of the whole world and astronomy-related people draw wide variety of astronomy pictures, make the photos of various astronomic events, solar and planets activities. ConceptDraw DIAGRAM diagramming and vector drawing software extended with Astronomy solution from the Science and Education area is the best choice for astronomy specialists. It gives the possibility to design professional looking astronomy pictures in a few minutes.Banking System
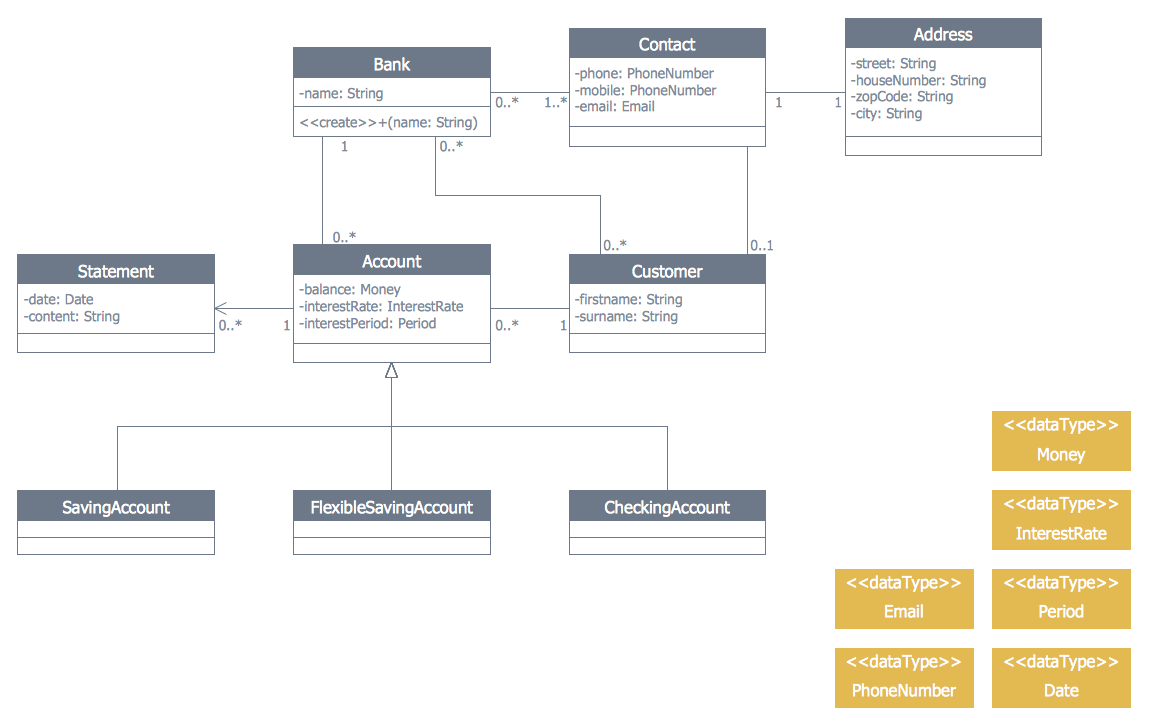
ConceptDraw DIAGRAM extended with ATM UML Diagrams Solution from the Software Development Area of ConceptDraw Solution Park is a powerful software for representing the ATM processes, for designing and building banking system and ATMs.- Yourdon and Coad Diagram | OOSE Method | Professionally ...
- Coad/ Yourdon's Object-Oriented Analysis model | Data Flow ...
- Yourdon and Coad Diagram | OOSE Method | Design Element ...
- Data Flow Diagrams | Dfd Vs Uml Ppt File
- Data Flow Diagrams (DFD) | Coad Yourdon Methodology Ppt
- Yourdon and Coad Diagram | Coad Yourdan In Ooad Ppt
- Coad/ Yourdon's Object-Oriented Analysis model | Cross-Functional ...
- Yourdon and Coad Diagram | Coad/ Yourdon's Object-Oriented ...
- UML Use Case Diagram Example Social Networking Sites Project ...
- Booch OOD Diagram | OOSE Method | Examples for OOSE Method ...


