This data-driven infographics example was redesigned from the Wikimedia Commons file: Benjamin Ebel Quick You Tube Survey Results.jpg.
The infographic survey includes horizontal bar graph "More Youtube than TV?", column chart "When do you watch Youtube?", and bubble diagram "Most watched content?". [commons.wikimedia.org/ wiki/ File:Benjamin_ Ebel_ Quick_ You_ Tube_ Survey_ Results.jpg]
This file is licensed under the Creative Commons Attribution-Share Alike 3.0 Unported license. [creativecommons.org/ licenses/ by-sa/ 3.0/ deed.en]
The column chart and bar graph sample "Quick YouTube Survey" was created using the ConceptDraw PRO diagramming and vector graphics software extended with the Data-driven Infographics" solution from the area "What is infographics" of ConceptDraw Solution Park.
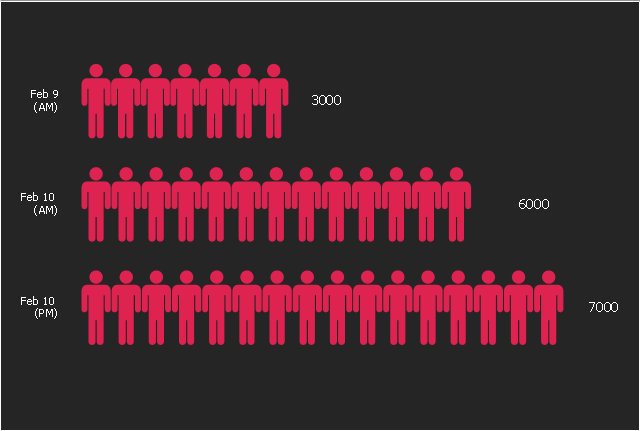
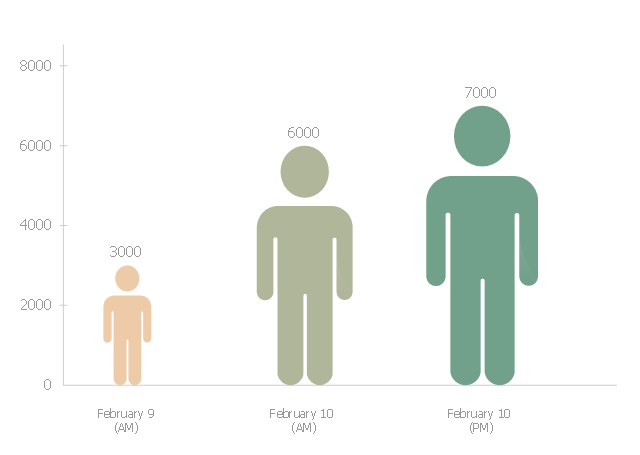
This picture bar graph sample shows increse in subscibers on YouTube to Anonymous' videos in 2008. It was designed on the base of the Wikimedia Commons file: A graph to show the increse in subscibers on YouTube to Anonymous' videos.jpg. [commons.wikimedia.org/ wiki/ File:A_ graph_ to_ show_ the_ increse_ in_ subscibers_ on_ YouTube_ to_ Anonymous%27_ videos.jpg]
This file is licensed under the Creative Commons Attribution 3.0 Unported license. [creativecommons.org/ licenses/ by/ 3.0/ deed.en]
"Anonymous (used as a mass noun) is a loosely associated international network of activist and hacktivist entities. A website nominally associated with the group describes it as "an internet gathering" with "a very loose and decentralized command structure that operates on ideas rather than directives". The group became known for a series of well-publicized publicity stunts and distributed denial-of-service (DDoS) attacks on government, religious, and corporate websites.
Anonymous originated in 2003 on the imageboard 4chan, representing the concept of many online and offline community users simultaneously existing as an anarchic, digitized global brain. Anonymous members (known as "Anons") can be distinguished in public by the wearing of stylised Guy Fawkes masks." [Anonymous (group). Wikipedia]
The pictorial chart example "The increse in subscibers on YouTube to Anonymous' videos" was created using the ConceptDraw PRO diagramming and vector drawing software extended with the Picture Graphs solution from the Graphs and Charts area of ConceptDraw Solution Park.
This pictorial bar chart sample shows the increse in subscibers on YouTube to Anonymous' videos. It was redesigned from the Wikimedia Commons file: A graph to show the increse in subscibers on YouTube to Anonymous' videos.jpg. [commons.wikimedia.org/ wiki/ File:A_ graph_ to_ show_ the_ increse_ in_ subscibers_ on_ YouTube_ to_ Anonymous%27_ videos.jpg]
This file is licensed under the Creative Commons Attribution 3.0 Unported license. [creativecommons.org/ licenses/ by/ 3.0/ deed.en]
"Anonymous (used as a mass noun) is a loosely associated international network of activist and hacktivist entities. A website nominally associated with the group describes it as "an internet gathering" with "a very loose and decentralized command structure that operates on ideas rather than directives". The group became known for a series of well-publicized publicity stunts and distributed denial-of-service (DDoS) attacks on government, religious, and corporate websites.
Anonymous originated in 2003 on the imageboard 4chan, representing the concept of many online and offline community users simultaneously existing as an anarchic, digitized global brain. Anonymous members (known as "Anons") can be distinguished in public by the wearing of stylised Guy Fawkes masks." [Anonymous (group). Wikipedia]
The image chart example "The increse in subscibers on YouTube to Anonymous' videos" was created using the ConceptDraw PRO diagramming and vector drawing software extended with the Basic Picture Graphs solution from the Graphs and Charts area of ConceptDraw Solution Park.
This picture bar graph sample shows increse in subscibers on YouTube to Anonymous' videos in 2008. It was designed on the base of the Wikimedia Commons file: A graph to show the increse in subscibers on YouTube to Anonymous' videos.jpg. [commons.wikimedia.org/ wiki/ File:A_ graph_ to_ show_ the_ increse_ in_ subscibers_ on_ YouTube_ to_ Anonymous%27_ videos.jpg]
This file is licensed under the Creative Commons Attribution 3.0 Unported license. [creativecommons.org/ licenses/ by/ 3.0/ deed.en]
"Anonymous (used as a mass noun) is a loosely associated international network of activist and hacktivist entities. A website nominally associated with the group describes it as "an internet gathering" with "a very loose and decentralized command structure that operates on ideas rather than directives". The group became known for a series of well-publicized publicity stunts and distributed denial-of-service (DDoS) attacks on government, religious, and corporate websites.
Anonymous originated in 2003 on the imageboard 4chan, representing the concept of many online and offline community users simultaneously existing as an anarchic, digitized global brain. Anonymous members (known as "Anons") can be distinguished in public by the wearing of stylised Guy Fawkes masks." [Anonymous (group). Wikipedia]
The pictorial chart example "The increse in subscibers on YouTube to Anonymous' videos" was created using the ConceptDraw PRO diagramming and vector drawing software extended with the Picture Graphs solution from the Graphs and Charts area of ConceptDraw Solution Park.
This file is licensed under the Creative Commons Attribution 3.0 Unported license. [creativecommons.org/ licenses/ by/ 3.0/ deed.en]
"Anonymous (used as a mass noun) is a loosely associated international network of activist and hacktivist entities. A website nominally associated with the group describes it as "an internet gathering" with "a very loose and decentralized command structure that operates on ideas rather than directives". The group became known for a series of well-publicized publicity stunts and distributed denial-of-service (DDoS) attacks on government, religious, and corporate websites.
Anonymous originated in 2003 on the imageboard 4chan, representing the concept of many online and offline community users simultaneously existing as an anarchic, digitized global brain. Anonymous members (known as "Anons") can be distinguished in public by the wearing of stylised Guy Fawkes masks." [Anonymous (group). Wikipedia]
The pictorial chart example "The increse in subscibers on YouTube to Anonymous' videos" was created using the ConceptDraw PRO diagramming and vector drawing software extended with the Picture Graphs solution from the Graphs and Charts area of ConceptDraw Solution Park.
What Is a Picture Graph?
What is a Picture Graph? It's one of the most useful way which allows explain the information, statistical data in a visual form using the pictures. ConceptDraw DIAGRAM extended with Picture Graphs solution from the Graphs and Charts area offers you the easiest way of Picture Graphs drawing.125 Ways to Integrate Social Media to Increase Your Business
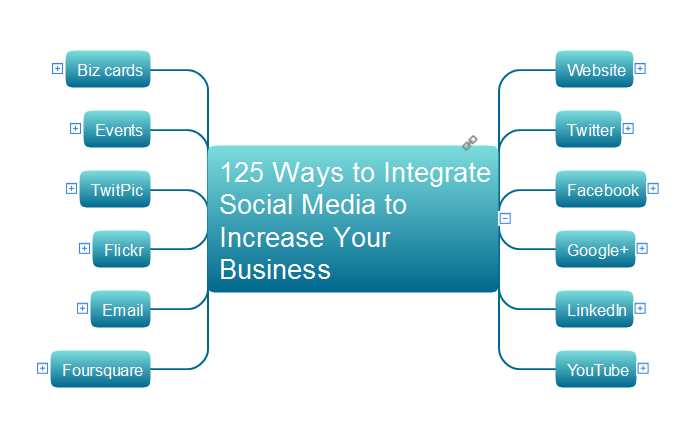
The social network services and social media are actively used in the modern business world to promote products and services to the market, and effectively communicate with customers. They are the most simple and effective way of setting the feedbacks, allow to organize effectively a dialogue with consumers, to provide for potential consumers the necessary information about a given product or service, and collect effortlessly the valuable reviews and opinions from the real customers. The social media allow you to read and analyze the information about different products, to compare them, to make the predictions about interesting products for particular categories of potential clients. This Mind Map designed in ConceptDraw MINDMAP illustrates 125 ways to integrate the social media to increase your business. The modern social media approaches to business marketing can be easy presented to others using the ConceptDraw MINDMAP application and the eLearning for Skype solution from ConceptDraw Solution Park."The interface is based around the home screen, a graphical list of available applications. iPhone applications normally run one at a time. Starting with the iPhone 4, a primitive version of multitasking came into play. Users could double click the home button to select recently opened. However, the apps never ran in the background. Starting with iOS 7, though, apps can truly multitask, and each open application runs in the background when not in use, although most functionality is still available when making a call or listening to music. The home screen can be accessed at any time by a hardware button below the screen, closing the open application in the process.
By default, the Home screen contains the following icons: Messages (SMS and MMS messaging), Calendar, Photos, Camera, YouTube, Stocks, Maps (Google Maps), Weather, Voice Memos, Notes, Clock, Calculator, Settings, iTunes (store), App Store, (on the iPhone 3GS and iPhone 4) Compass, FaceTime and GameCenter were added in iOS 4.0 and 4.1 respectively. In iOS 5, Reminders and Newsstand were added, as well as the iPod application split into separate Music and Videos applications. iOS 6 added Passbook as well as an updated version of Maps that relies on data provided by TomTom as well as other sources. iOS 6 also added a Clock application onto the iPad's homescreen. However, it also no longer support YouTube. Docked at the base of the screen, four icons for Phone, Mail, Safari (Internet), and Music delineate the iPhone's main purposes. On January 15, 2008, Apple released software update 1.1.3, allowing users to create "Web Clips", home screen icons that resemble apps that open a user-defined page in Safari. After the update, iPhone users can rearrange and place icons on up to nine other adjacent home screens, accessed by a horizontal swipe." [iPhone. Wikipedia]
The example "iPhone OS (iOS) graphic user interface (GUI) - Alarm setting" was created using the ConceptDraw PRO diagramming and vector drawing software extended with the Graphic User Interface solution from the Software Development area of ConceptDraw Solution Park.
The vector stencils library "Android product icons" contains 50 application icons.
Use it to design user interface of your Android software application.
The app icons example "Design elements - Android product icons" was created using the ConceptDraw PRO diagramming and vector drawing software extended with the "Android user interface" solution from the "Software Development" area of ConceptDraw Solution Park.
How to Make SWOT Analysis in a Word Document
A SWOT Analysis is a popular tool of the strategic planning which is used to evaluate the Strengths, Weaknesses, Opportunities, and Threats that are involved in any businesses. Use of mind maps allows you to collect a lot of information used for SWOT Analysis, visually structure it and also identify the relationships between different parts of this information. SWOT and TOWS Matrix Diagrams solution for ConceptDraw Solution Park combines professional visual advantages of ConceptDraw MINDMAP software and presentation capabilities of ConceptDraw DIAGRAM , which together provide a complete work solution. The SWOT and TOWS diagrams, matrices or mind maps produced in ConceptDraw DIAGRAM using the predesigned vector objects or filling the ready templates, can be then easily exported to Microsoft Word, Microsoft Visio, Microsoft PowerPoint, Adobe PDF, and many other electronic file formats. The possibility of export makes easy the use of SWOT diagrams designed in ConceptDraw DIAGRAM and lets you efficiently collaborate even with people who maybe don't have this software.- Line Chart Templates | The increse in subscibers on YouTube to ...
- Language Learning | Design elements - Furniture | The increse in ...
- Picture Graphs | Data Flow Diagram Youtube
- Quick YouTube Survey | HR workflow - Vector stencils library ...
- Entity-Relationship Diagram (ERD) | Picture Graphs | Youtube Erd ...
- The increse in subscibers on YouTube to Anonymous' videos
- HR workflow - Vector stencils library | Quick YouTube Survey | Geo ...
- The increse in subscibers on YouTube to Anonymous' videos
- Swim Lane Diagram Customer Wants To Buy Product Youtube
- Quick Recipes | Anyone Have an ERD Symbols Quick Reference ...
- The increse in subscibers on YouTube to Anonymous' videos
- How To Download Youtube
- ConceptDraw News | New MindTweet solution: extends Twitter ...
- iPhone OS (iOS) graphic user interface (GUI) - Alarm setting ...
- iPhone User Interface | iPhone OS (iOS) graphic user interface (GUI ...
- iPhone OS (iOS) graphic user interface (GUI) - Alarm setting | App ...
- iPhone OS (iOS) graphic user interface (GUI) - SMS application ...
- Design elements - Picture bar graphs | Picture graphs - Vector ...
- iOS 8 / iPhone 6 home screen - Template


-graphic-user-interface-(gui)---alarm-setting.png--diagram-flowchart-example.png)
