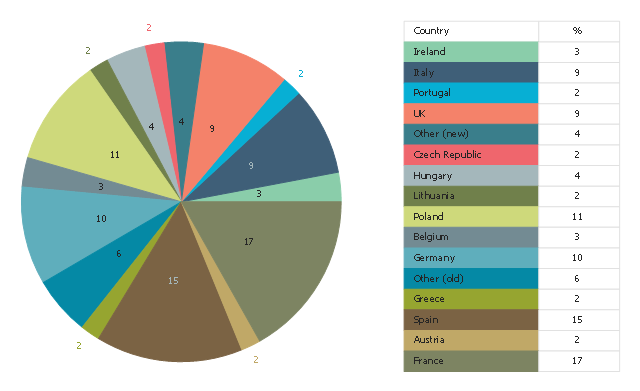
This pie chart sample shows the percentage of EU farm land by country. It was designed on the base of the Wikimedia Commons file: EUFarm-eng.svg. [commons.wikimedia.org/ wiki/ File:EUFarm-eng.svg]
"The agricultural sector is supported by subsidies from the European Union in the form of the Common Agricultural Policy (CAP). In 2013 this represented approximately €45billion (less than 33% of the overall budget of €148billion) of the EU's total spending. It was used originally to guarantee a minimum price for farmers in the EU. This is criticised as a form of protectionism, inhibiting trade, and damaging developing countries; one of the most vocal opponents is the UK, the second largest economy within the bloc, which has repeatedly refused to give up the annual UK rebate unless the CAP undergoes significant reform; France, the biggest beneficiary of the CAP and the bloc's third largest economy, is its most vocal proponent." [Economy of the European Union. Wikipedia]
The pie chart example "Percentage of EU farm land by country" was created using the ConceptDraw PRO diagramming and vector drawing software extended with the Pie Charts solutiton of the Graphs and Charts area in ConceptDraw Solution Park.
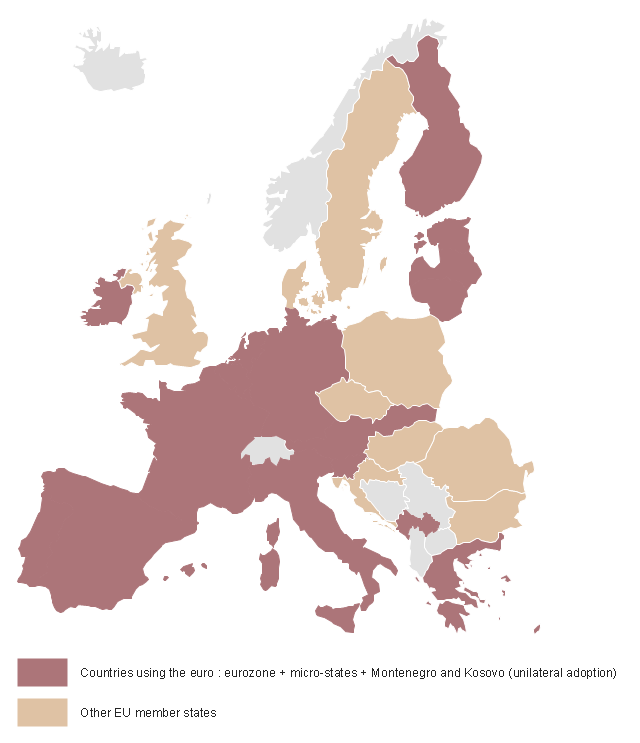
This Germany political map example was created on the base of Wikimedia Commons file: BlueEurozone.svg. [commons.wikimedia.org/ wiki/ File:BlueEurozone.svg]
"The eurozone, officially called the euro area, is a monetary union of 19 of the 28 European Union (EU) member states which have adopted the euro (€) as their common currency and sole legal tender. The other nine members of the European Union continue to use their own national currencies.
The eurozone consists of Austria, Belgium, Cyprus, Estonia, Finland, France, Germany, Greece, Ireland, Italy, Latvia, Lithuania, Luxembourg, Malta, the Netherlands, Portugal, Slovakia, Slovenia, and Spain." [Eurozone. Wikipedia]
The political map example "Map of Germany in Eurozone" was designed using the ConceptDraw PRO software extended with the Map of Germany solution from the Maps area of ConceptDraw Solution Park.
This vector stencils library contains 195 cloud computing icons.
Use it to design cloud computing infographic and diagrams with ConceptDraw PRO software.
"Cloud computing, also on-demand computing, is a kind of Internet-based computing that provides shared processing resources and data to computers and other devices on demand. It is a model for enabling ubiquitous, on-demand access to a shared pool of configurable computing resources (e.g., networks, servers, storage, applications and services), which can be rapidly provisioned and released with minimal management effort. Cloud computing and storage solutions provide users and enterprises with various capabilities to store and process their data in third-party data centers.
Cloud computing has become a highly demanded service or utility due to the advantages of high computing power, cheap cost of services, high performance, scalability, accessibility as well as availability." [Cloud computing. Wikipedia]
The vector stencils library "Cloud clipart" is included in the Cloud Computing Diagrams solution from the Computer and Networks area of ConceptDraw Solution Park.
- UML Deployment Diagram Example - ATM System UML diagrams ...
- Components of ER Diagram | Entity Relationship Diagram Symbols ...
- Bar Diagrams for Problem Solving. Create economics and financial ...
- Cloud clipart - Vector stencils library
- Middle East - Political map | Political map of Germany | Map of ...


-cloud-clipart---vector-stencils-library.png--diagram-flowchart-example.png)
-cloud-clipart---vector-stencils-library.png--diagram-flowchart-example.png)


-cloud-clipart---vector-stencils-library.png--diagram-flowchart-example.png)


-cloud-clipart---vector-stencils-library.png--diagram-flowchart-example.png)
-cloud-clipart---vector-stencils-library.png--diagram-flowchart-example.png)


