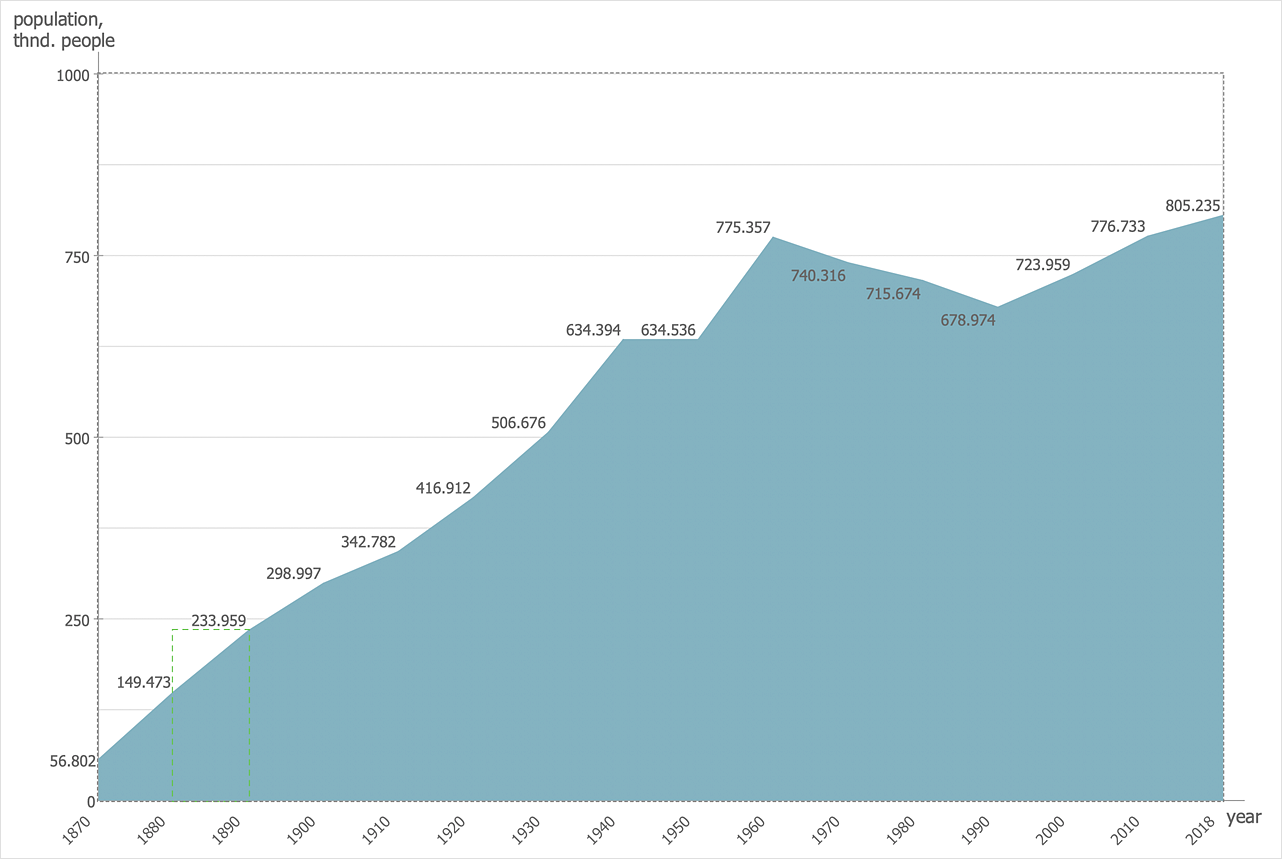
How to Create a Basic Diagram Using Basic Charts SolutionsWhen we need to show some information that consists of a set of numerical data, statistics, for instance, we ordinarily choose graphics. Using of visual approach help us show statistical data and other similar information in a form quite clear for analysis and comparison. Using the corresponding charts we can reveal dependencies and tendencies. ConceptDraw DIAGRAM enables you to draw easily the most featured types of charts using the family of Basic Charts solutions. This article uses the Area chart example to explain what you need to get started drawing basic charts using the Basic Area Charts solution.


Result: ConceptDraw DIAGRAM allows you to draw the most popular types of charts quickly and effortlessly. |
How it works:
Useful Solutions and Products:
|
 How To Use Solutions