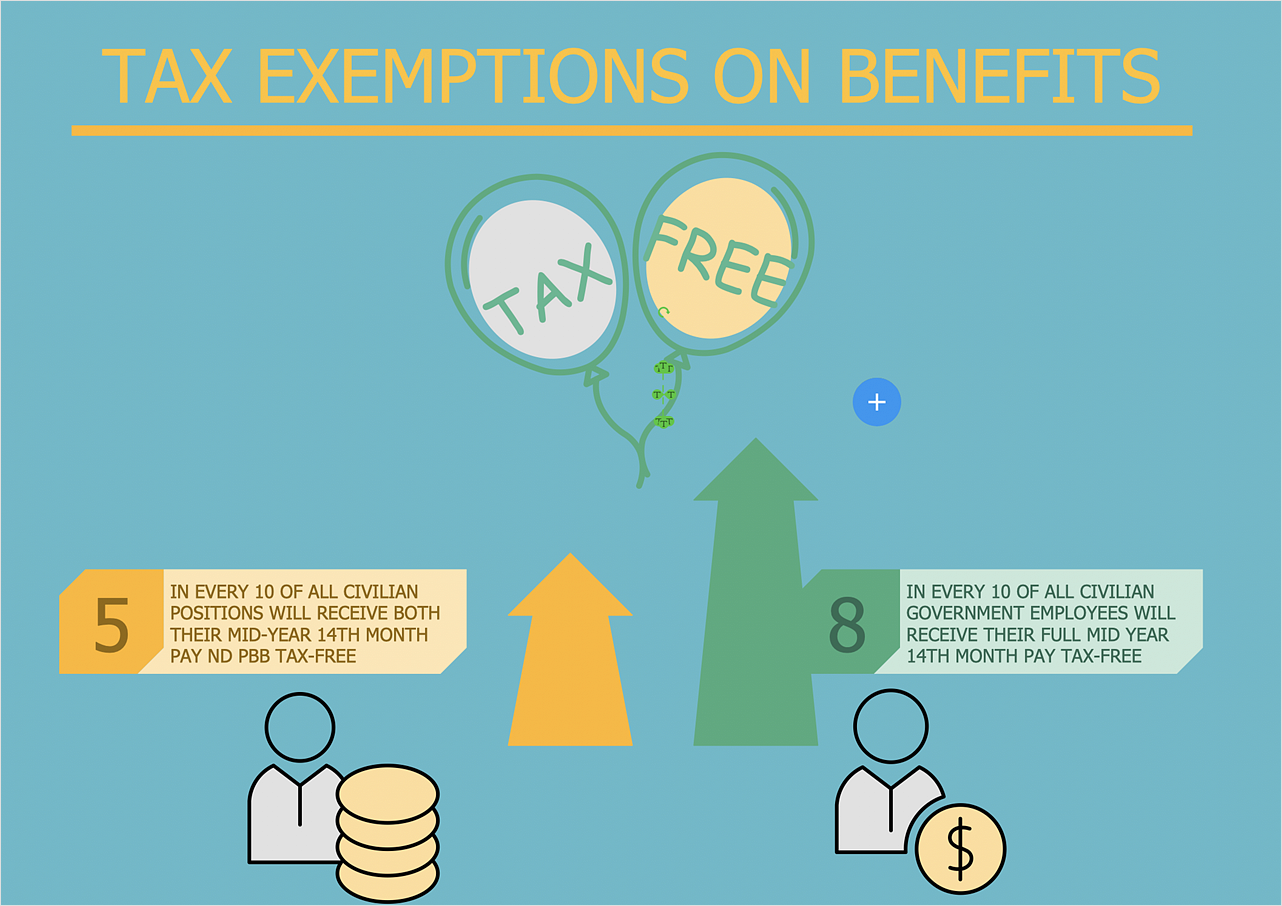
How to Make Business and Financial Infographics
The utilization of illustrations in business is widespread. Illustrations adorn the infographics, presentations, web-pages and many other visual outputs. Illustrations help to understand any information tied with business and finances. Most of the financial information becomes easy to understand when the issue explained by clear illustration rather than written on a large amount of paper. Using ConceptDraw Business and Finance solution, you can quickly prepare presentations, web pages and other illustrative outputs related to business and finance. This article describes how to make business infographics on the example of illustration showing the circular flow of inputs and outputs between businesses and households.
- Run the ConceptDraw DIAGRAM new document.
- Lets start from making a background for our drawing. There are some ways to create a background for ConceptDraw drawings. Here, we will explain how to create the background for a single-page document.
- Open the Basic Shapes library — one of the basic ConceptDraw libraries. Select the Rectangle object and place it to your document.

- Next, resize an object by dragging selection handles until the rectangle fills the entire page.
- Set the background color using the Fill option. Find it in the Format panel.

- Next, move the background to another layer. Simply select the layer number in the Info panel.

- Lock the background layer from changes.

- Now you can start drawing infographics. Select libraries from the Business and Finance in the Library panel and add the necessary elements to your document — click on an object and then click on the document, at the place you want the object to be inserted.
- Add a text to infographics using the Text Box Tool.

- Finally, you can export your drawing as MS PowerPoint® and Adobe PDF files using Export options from the File menu.

Result: Using ConceptDraw DIAGRAM with its solution for making business and finance graphic, you can effortlessly design a huge number of related illustrations, schematics and infographics.

|
How it works:
- Set of ready-to-use templates supplied with ConceptDraw DIAGRAM
- Collection of professional samples supports each template
Useful Solutions and Products:
- Easily draw charts and diagrams.
- Visualize business information
- Block Diagrams
- Bubble Diagrams
- Circle-Spoke Diagrams
- Circular Arrows Diagrams
- Concept Maps
- Flowcharts
- Venn Diagrams
- Typography graphic
- Typography fonts
- Special templates
- Infographic examples
- Diagraming and Charts
- Vector Illustrations
- Maps
- Floor plans
- Engineering drawings
- Business dashboards
- Infographics
- Presentation
- Over 10 000 vector stencils
- Export to vector graphics files
- Export to Adobe Acrobat® PDF
- Export to MS PowerPoint®
- Export to MS Visio® VSDX, VDX
|


 Business-specific Drawings