How to Create an Object-Role Modeling (ORM) Diagram
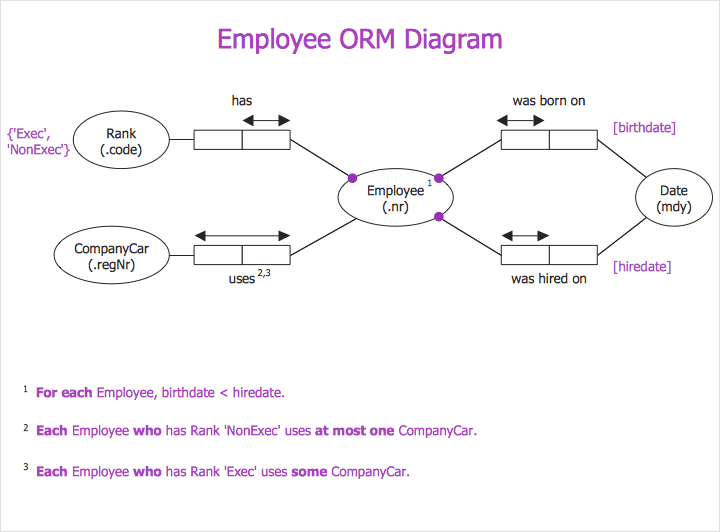
Object-role Modeling is a semantic modeling method that considers any process as an aggregate of some objects and the roles they play. An ORM diagram is used to display objects, the relationships between them, the roles the objects have in such relationships and constraints within these interactions. This article describes how to create a simple example of an ORM diagram that depicts a model of employee data: birthdate, hires date, the rank, and the company car number. This diagram was created using Object-Role Modeling (ORM) Diagrams solution for ConceptDraw DIAGRAM The solution includes a vector stencil library containing 32 objects and a set of sample diagrams.
- Run ConceptDraw DIAGRAM.
- Find the Object Role Modeling (ORM) Diagram in the Solutions panel and select the library.

- Drag oval objects that represent entities from the library onto the drawing page.
- Type the entity's name and then type the entity description in brackets.

- Add rectangles that symbolize roles, objects play in relationships.

- Connect entities and roles with Role Connectors.
- The double arrowhead above the roles will indicate uniqueness constraints (one-to-one, one-to-many, many-to-many).

- Use the Arrange&Size panel to arrange objects on the diagram properly.

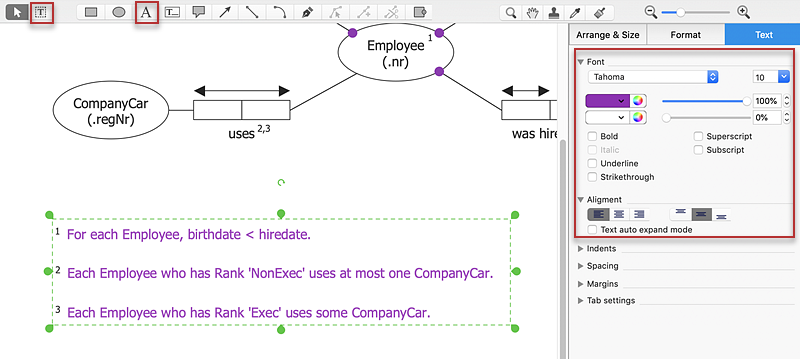
- Finally, you can add a legend. Use the Format button to activate the Text side-panel, enabling you to format the text of your legend.

Result: As object-role models are attribute-free, the ORM diagram can be useful when mapping the data structure of elementary processes.

|
How it works:
- Set of ready-to-use templates supplied with ConceptDraw DIAGRAM
- Collection of professional samples supports each template
- Professional drawing tools
Useful Solutions and Products:
- Chen Notation
- Crow’s Foot Notation
- Data Flow Diagrams (DFD)
- IDEF0 Diagrams
- SYSML Diagrams
- Rapid UML
- iPhone User Interface
- macOS User Interface
- Windows 10 User Interface
- Android User Interface
- Website Wireframe
- Diagraming and Charts
- Vector Illustrations
- Maps
- Floor plans
- Engineering drawings
- Business dashboards
- Infographics
- Presentation
- Over 10 000 vector stencils
- Export to vector graphics files
- Export to Adobe Acrobat® PDF
- Export to MS PowerPoint®
- Export to MS Visio® VSDX, VDX
|


 Business-specific Drawings