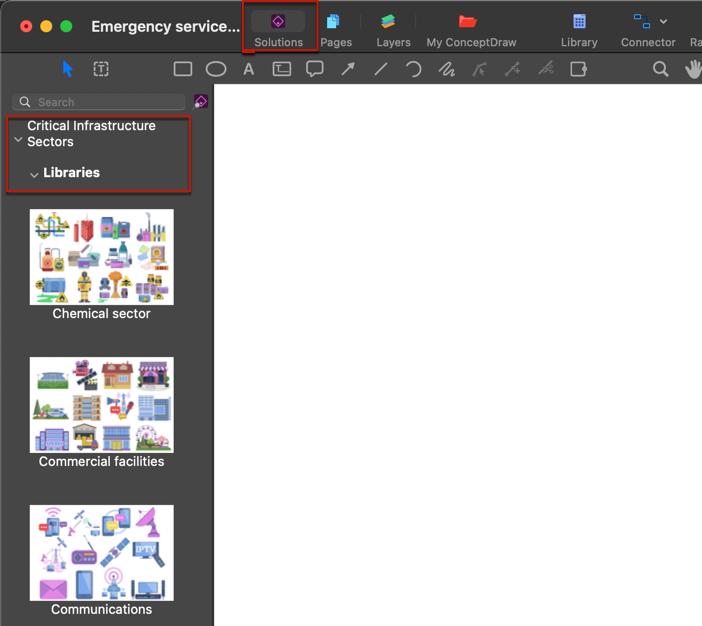
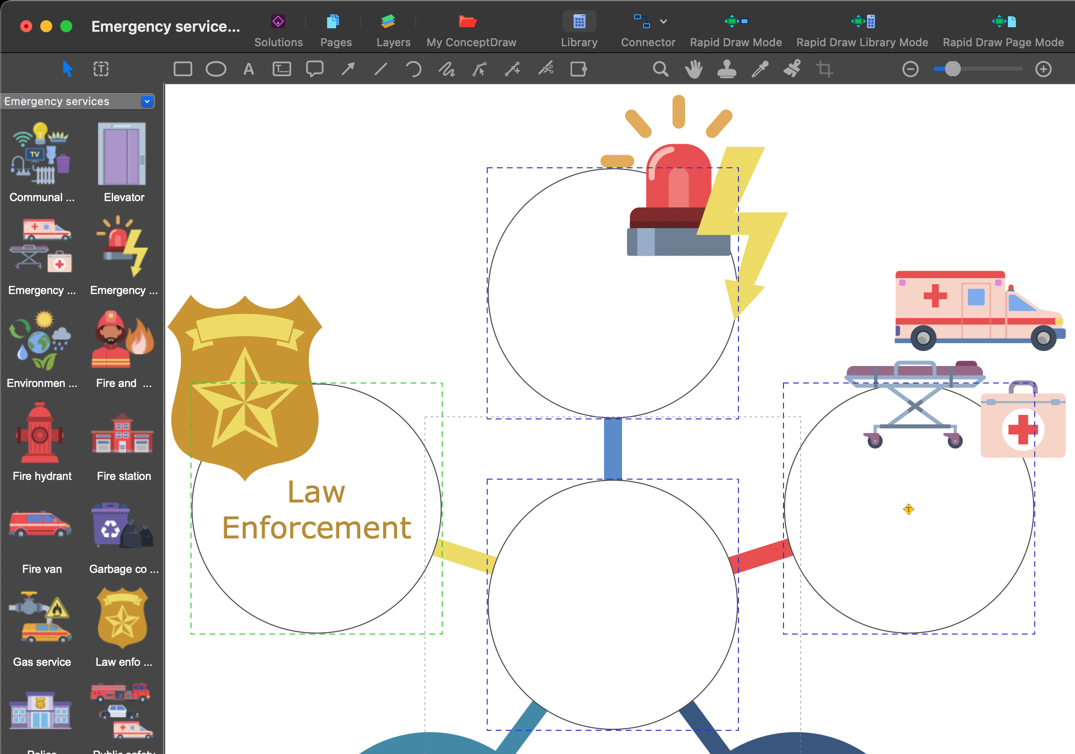
How to Create Infographics and Diagrams Referred to the Critical Infrastructure SectorsCritical infrastructure refers to the systems and assets, whether physical or virtual, that are so vital to a country that their incapacitation or destruction would have a debilitating effect on national security, the economy, public health, or safety. Infographics and diagrams can be powerful tools for conveying related information in a visually appealing and easily understandable format. You can enhance presentations with diagrams to illustrate the interconnectedness of critical infrastructure sectors. The sample infographics were created using the Critical Infrastructure Sectors solution for ConceptDraw DIAGRAM. When creating or using infographics and diagrams related to Critical Infrastructure Sectors, consider the following steps.


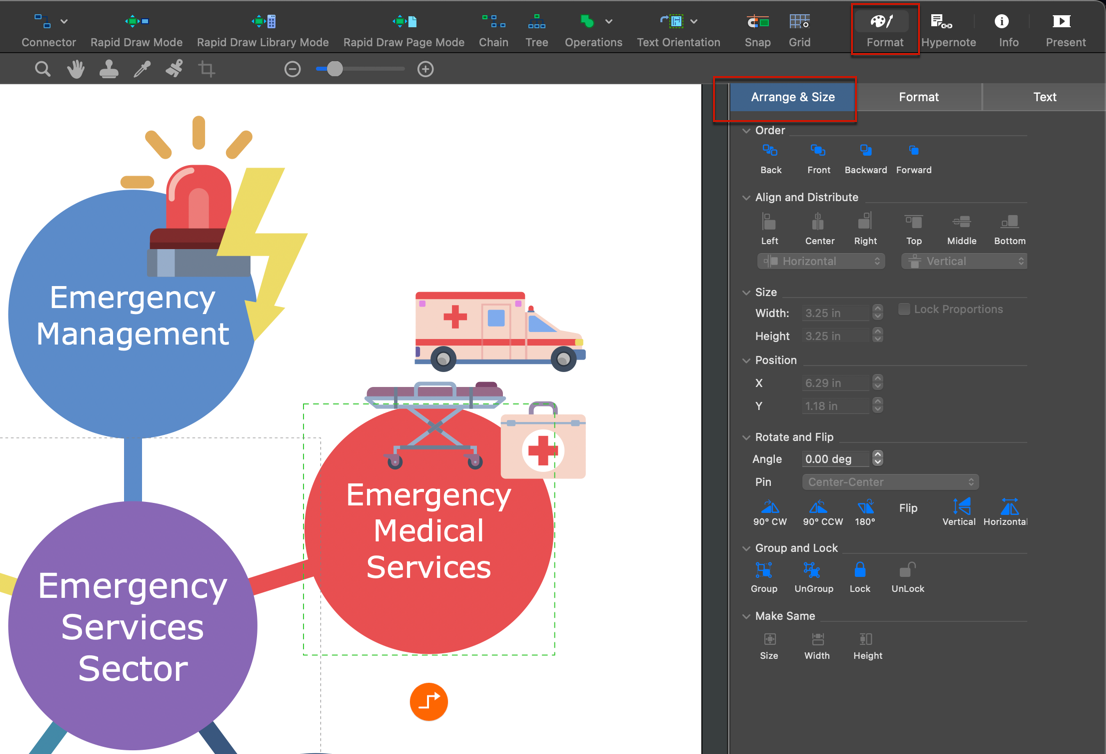
Result: This sample diagram was created in ConceptDraw DIAGRAM using the combination of libraries from the Critical Infrastructure Sector solution. Approximately 15 minutes of your time will be required for the creation of such professional-looking graphics. Any of the sample ConceptDraw documents that come with Solutions can be used as a good starting point for creating your diagrams. |
How it works:
Useful Solutions and Products:
|
 Business-specific Drawings