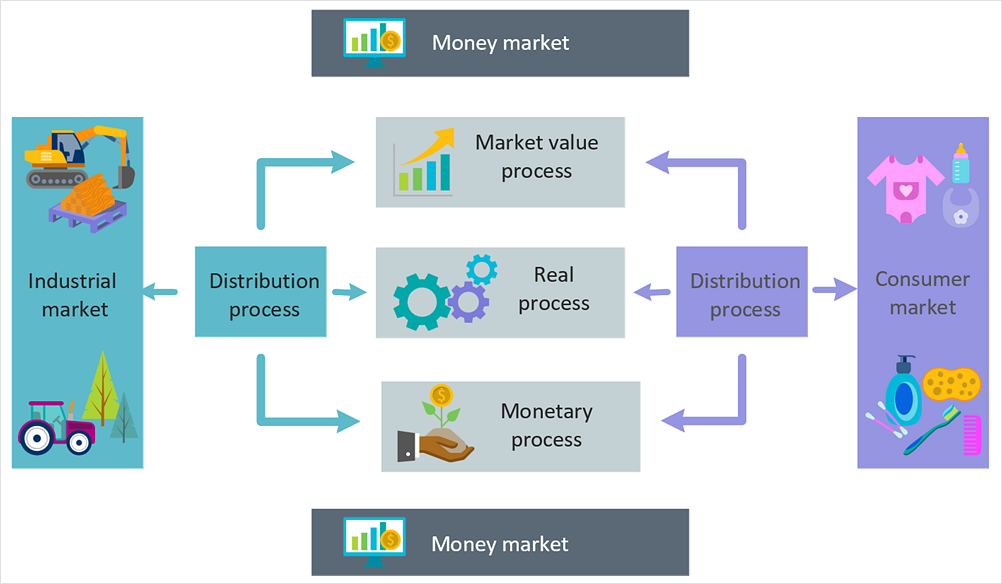
How to Create Economy InfographicsThis economy infographics created using the Economy Infographics solution for ConceptDraw DIAGRAM illustrate the general processes that are realized within an average manufacturing company. The number of processes, such as production, distribution, market value, and monetary processes is designated among them. Each of these activities has its purposes, justification, and key indicators. Each real business is unique and its processes can be arranged in different modes, but the listed above ones are the general for any business. The manufacturing and distribution processes occur simultaneously. The production process includes the production of goods, their distribution between different markets, and income distribution as well. The diagram shows the distribution of goods between industrial and consumer markets. The monetary process includes all points related to business financing. The market value process determines the value of the given company in the investment markets.


Result: Any of ConceptDraw’s infographics examples can be used as a good start for your infographics. |
How it works:
Useful Solutions and Products:
|
 Business-specific Drawings