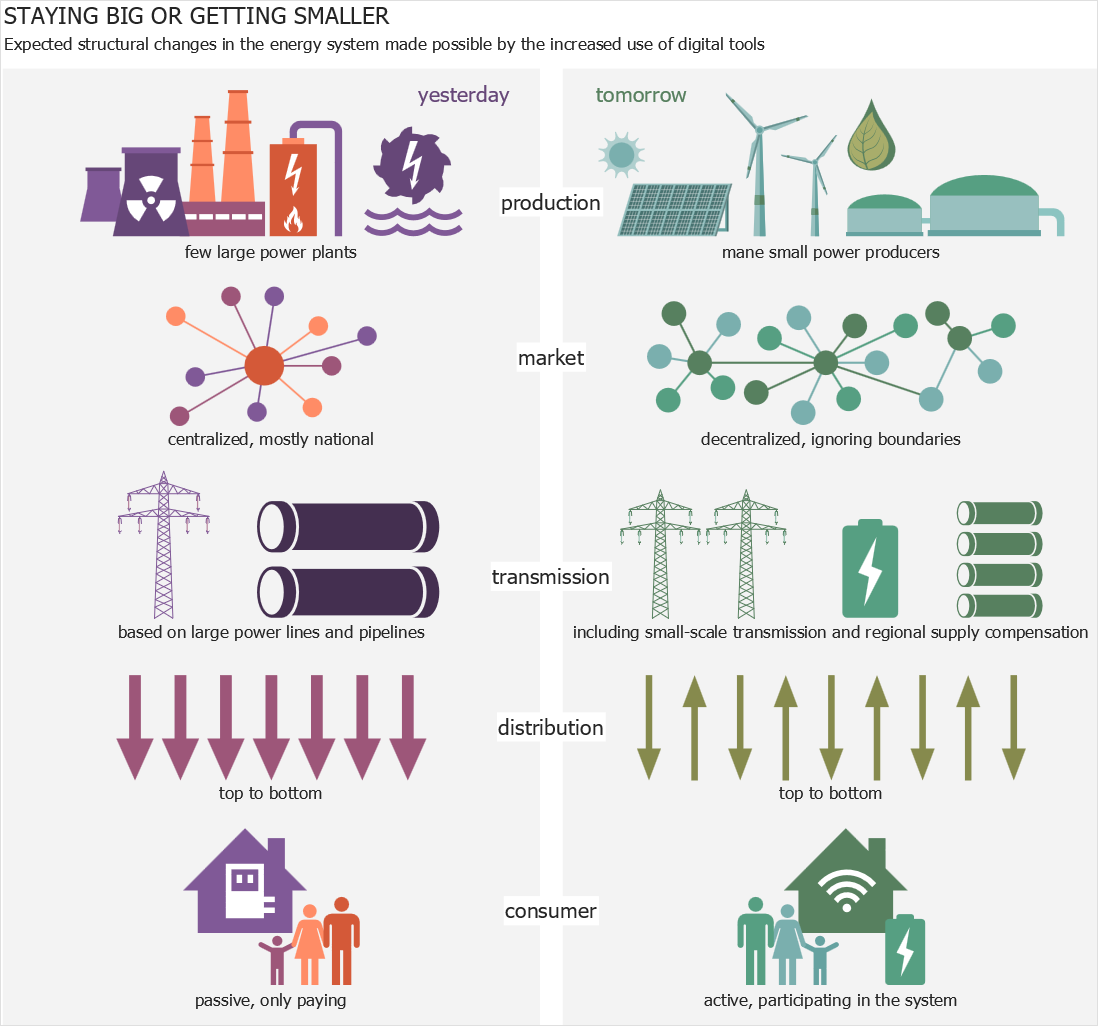
How to Create Energy Industry InfographicsThis sample infographics show a comparison of a traditional electrical system vs a smart grid. A smart grid is a modern electric network providing a bifacial flow of electricity and data. Smart grids have self-monitoring and self-healing capabilities and allow energy consumers to manage power consumption effectively. All the characteristics of the traditional system are presented on the left side of the diagram, and the characteristics of the smart grid are on the right. The ability to create infographics, schematics, and slides for presentations on the energy industry is provided by the Energy Industry Infographics solution. It extends ConceptDraw DIAGRAM with 9 libraries containing 174 scalable vector graphic objects that can be used when creating different illustrations related to the production and consumption of any kind of energy. ConceptDraw DIAGRAM with the vector drawing tools extended with samples and libraries of the Energy Industry Infographics solution is the ideal medium for creating designs of this type.


Result: Any of ConceptDraw’s infographics examples can be used as a good start for your infographics. |
How it works:
Useful Solutions and Products:
|
 Business-specific Drawings