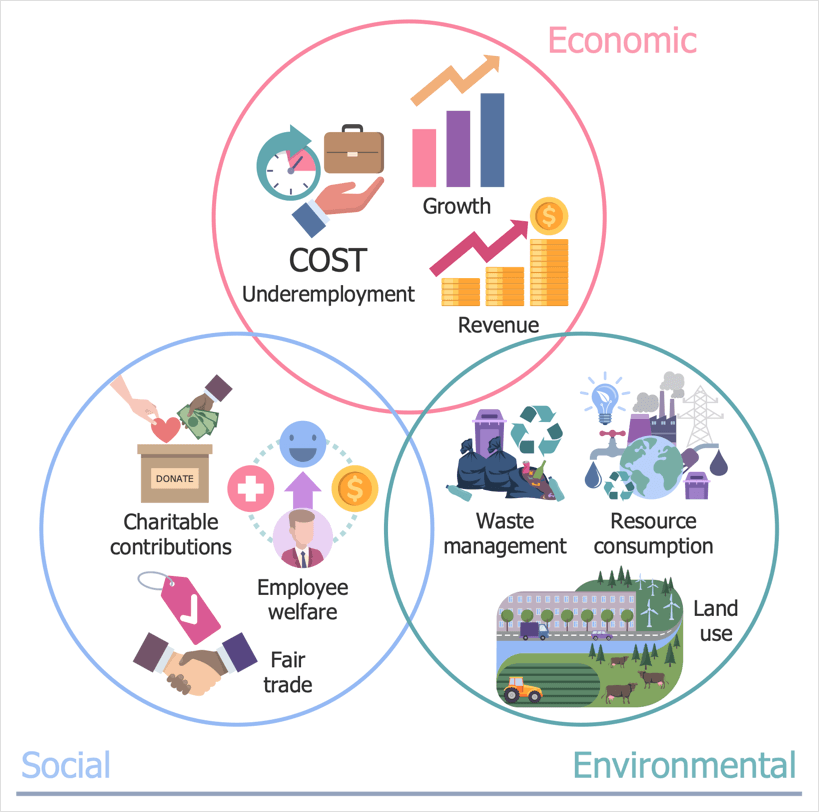
How to Illustrate ESG Methods with InfographicsEnvironmental, Social, and Corporate Governance (ESG) is an effective decision-making tool for investors. Investors consider ESG criteria along with traditional financial analysis to better assess risk when making investment decisions. The ESG analysis activity of business related to environmental protection, social issues, and corporate governance. These three ESG criteria help to evaluate the attractiveness and risks of the business for investors. This example of infographics was created using the combination of libraries from the ESG solution for ConceptDraw DIAGRAM. It illustrates a Triple Bottom Line (TBL). TBL is an accounting system used by the ESG method to evaluate the performance of the organization and the value of the business. It expands the traditional financial reporting structure to include three parts: social, environmental, and economic. Using TBL helps companies analyze their operations and maximize profits without compromising the environment.
The Environmental, Social, and Corporate Governance solution extends ConceptDraw DIAGRAM with 6 libraries containing 137 vector graphics icons and 14 samples containing images, symbols, and pictograms for designing professionally looking diagrams related to the ESG approach, its processes, goals, and ways for their achievement.
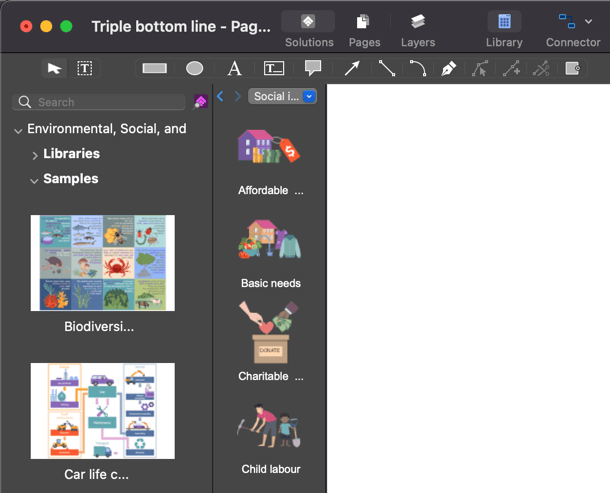
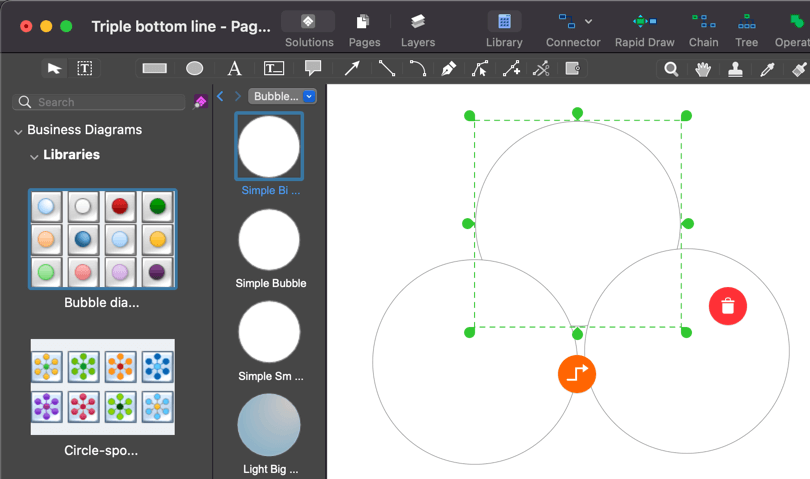
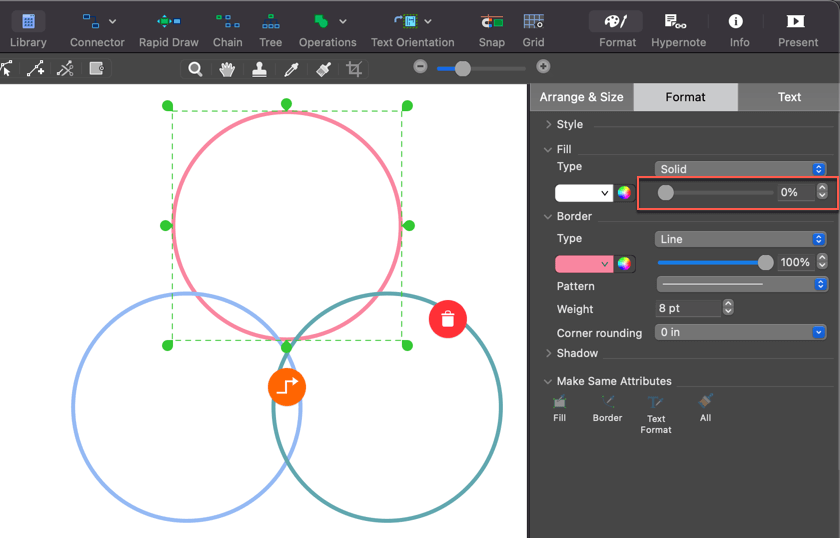
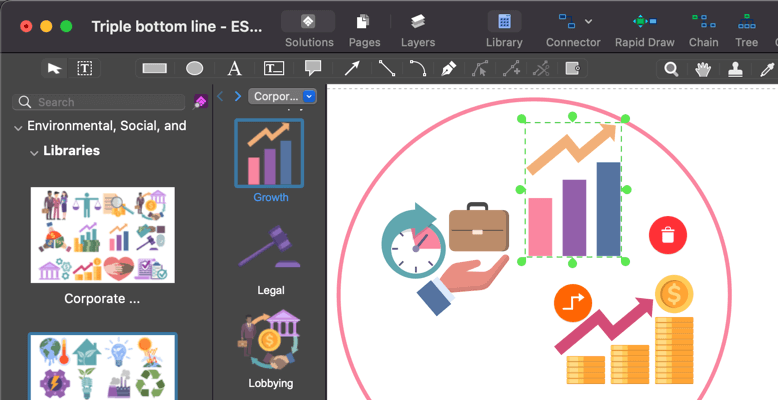
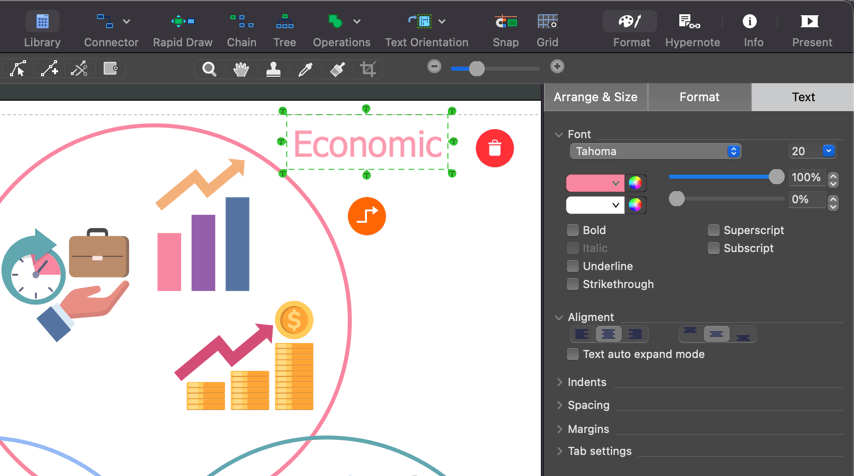
Result: This sample diagram was created in ConceptDraw DIAGRAM using the combination of libraries from the Environmental, Social, and Corporate Governance Solution. Approximately 10 minutes of your time will require the creation of such professional-looking graphics. |
How it works:
Useful Solutions and Products:
|
 Business-specific Drawings