How to Change the Measurement Units and Drawing Scale
Charts that represent real objects with precise dimensions smaller or larger by some amount are the scaled drawings. Floor plans, maps, technical blueprints are always the scaled drawings. Scale drawings are similar to dimensions of the real object. Various units of measurement are applied to depicting dimensions. When creating a scaled drawing we can use meters, centimeters, and millimeters; we also can use yards, feet, and inches. This is because the US utilize its own system of units, and the other countries take the metric system of measurement units. ConceptDraw DIAGRAM offers the easy way of choosing the appropriate units of measurement for your scaled drawing. ConceptDraw DIAGRAM allows you to make different drawings with different measurement units and scales.
- Open ConceptDraw DIAGRAM document for which you want to change the drawing scale.
- In the File Menu click the Document Properties item and select the Units tab.
- Click Pre-defined scale, and then select a proper Pre-defined metric, architectural, or civil engineering scale. You can select Custom Scale and type your own scale values.

- The document Rulers display measurement units of the current document at the upper left corner of the page.
Here you can quickly change units of the document — just click and select new items from the drop-down list.
Note: You may want to change the measurement units to pixels. Be note, that a pixel is not a unit of measurement. It is just a dot on a screen and the size of the dot varies for different screens. By setting the measurement units to pixels, you get the size of the object valid only for the current screen type.

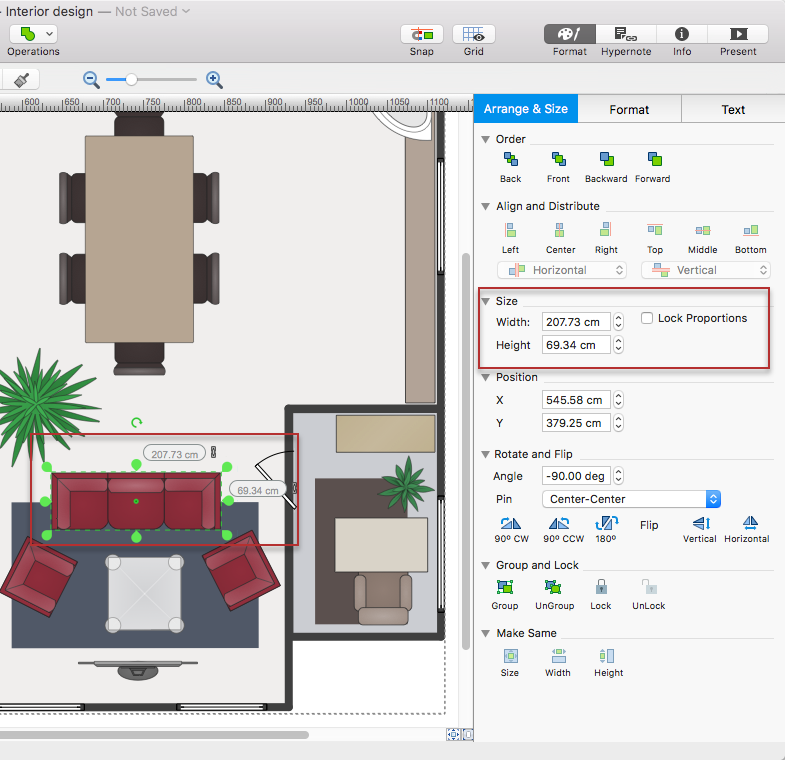
- Optionally, you can change an object's dimensions using the Shape-Size boxes that can be activated from the View menu or using the Size section of the Arrange & Size panel.

|
How it works:
- Set of ready-to-use templates supplied with ConceptDraw DIAGRAM
- Collection of professional samples supports each template
Useful Solutions and Products:
- Easily draw charts and diagrams.
- Visualize business information
- Block Diagrams
- Bubble Diagrams
- Circle-Spoke Diagrams
- Circular Arrows Diagrams
- Concept Maps
- Flowcharts
- Venn Diagrams
- libraries based on the BPMN 2.0 standard.
- Quickly develop any business processes using RapidDraw interface
- Diagraming and Charts
- Vector Illustrations
- Maps
- Floor plans
- Engineering drawings
- Business dashboards
- Infographics
- Presentation
- Over 10 000 vector stencils
- Export to vector graphics files
- Export to Adobe Acrobat PDF
- Export to MS PowerPoint
- Export to MS Visio VSDX, VDX
|


 Edit Drawing